OM-Interactive 4600 E. Washington
4600e. washington
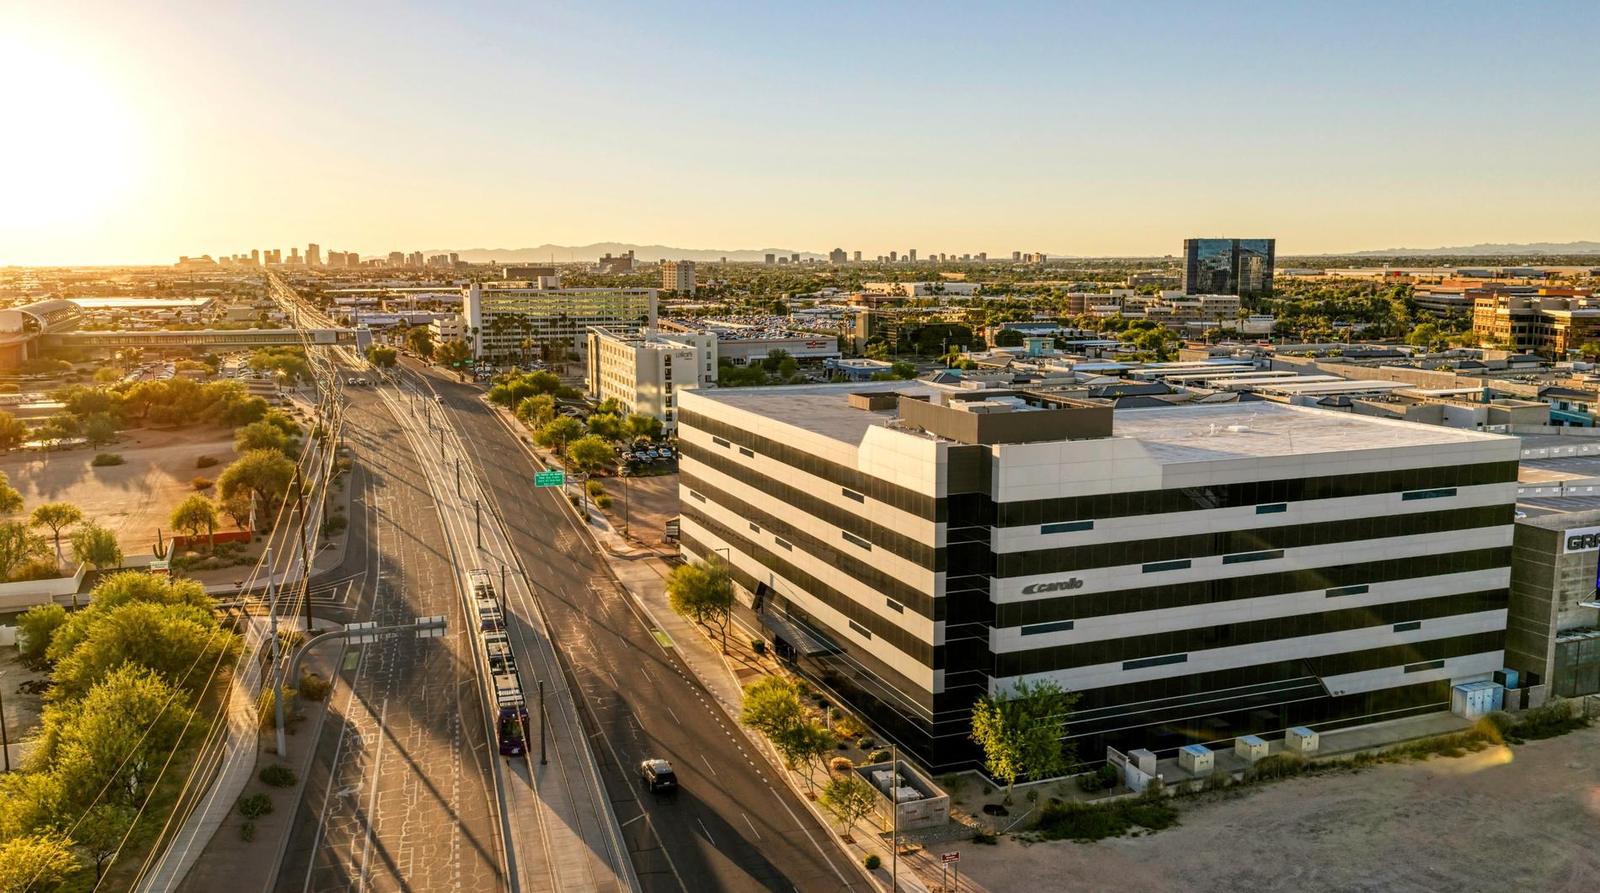
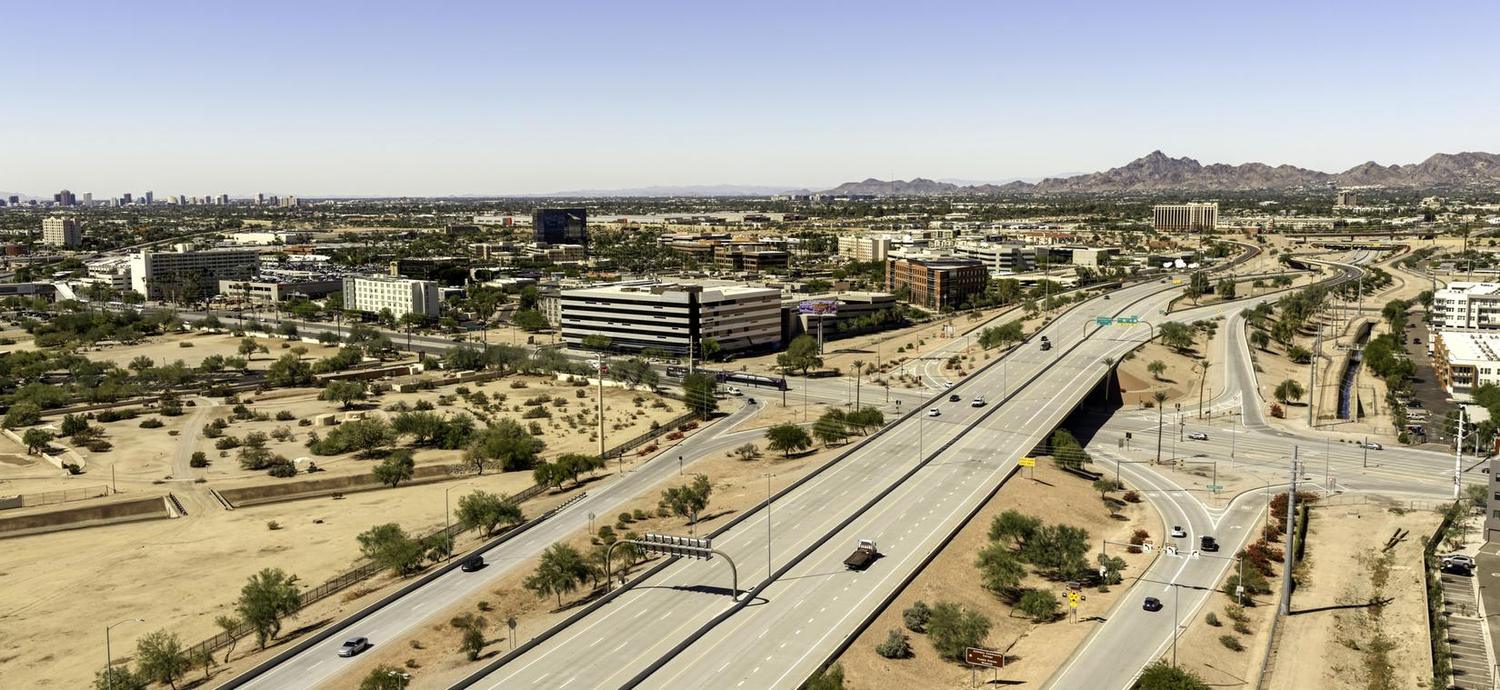
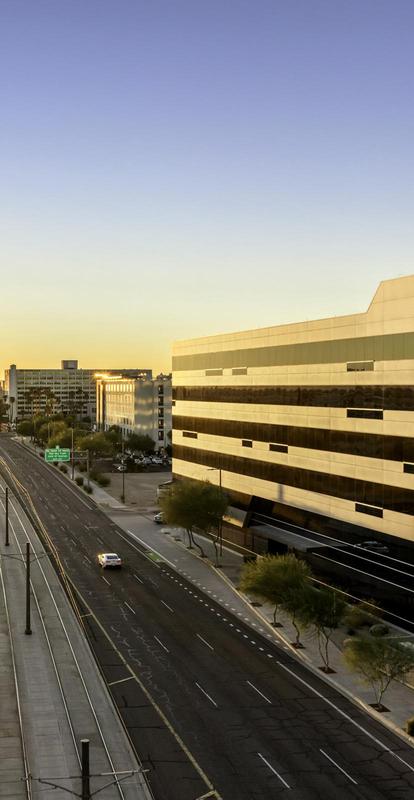
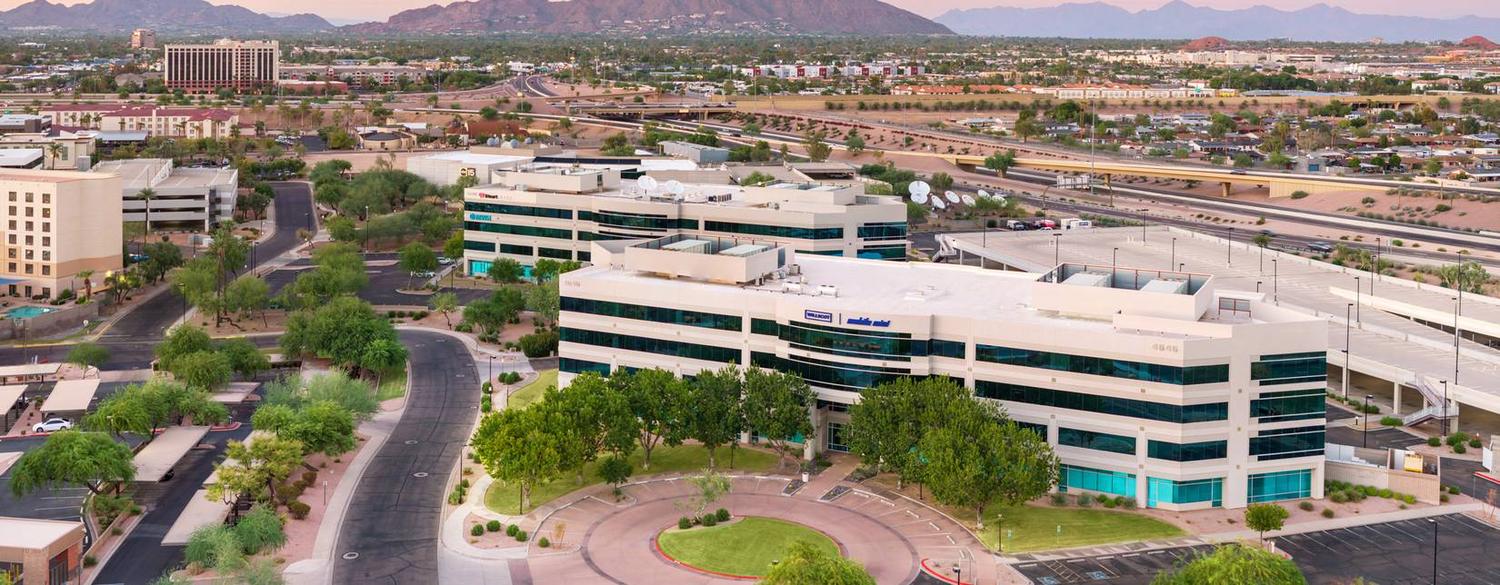
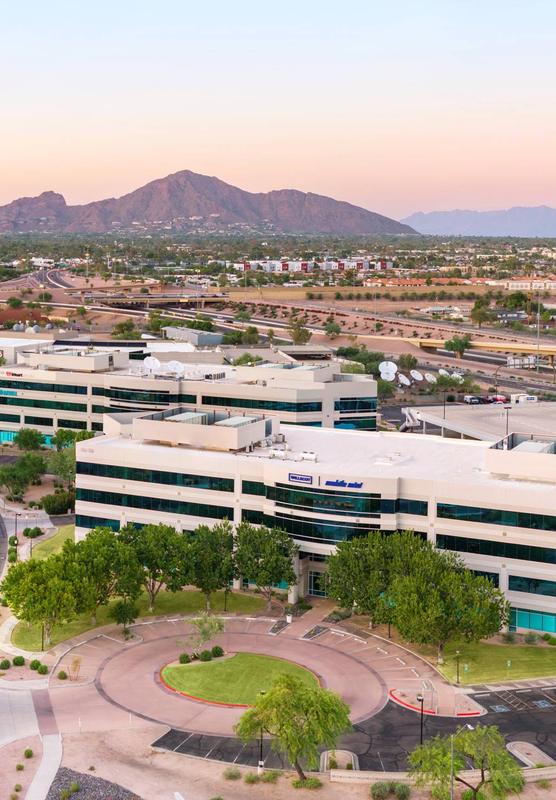
4600 E. Washington at sunrise, aerial view with the Phoenix skyline
Offering Memorandum · Class A value-add · Unpriced

4600 E. Washington

4600 East Washington Street · Phoenix, Arizona 85034
±188,311 SFNet rentable area
±48%Leased
±98,800 SFAvailable today
±32,000 SFFloor plates
2008Year built
The complete book
Investment Highlights

The Opportunity

  • Six (6)-story, ±188,311 SF Class A multi-tenant office building with a detached five (5)-level parking garage, completed in 2008 and honored as NAIOP Arizona's 2008 Spec Office Building of the Year.
  • ±48% leased—roughly ±98,800 SF of Class A space available today in a trade area where the recovery is already underway.
  • Western Alliance Bank just leased 108,960 SF at One and Three Gateway—the largest lease in metro Phoenix in Q3 2026—consolidating its Phoenix-area offices two blocks from the subject.
  • Another competitor that recently traded hands has signed three leases totaling ±23,000 SF with a 61,000 SF lease pending; eight of the 10 direct competitors in the area are over 85% leased.
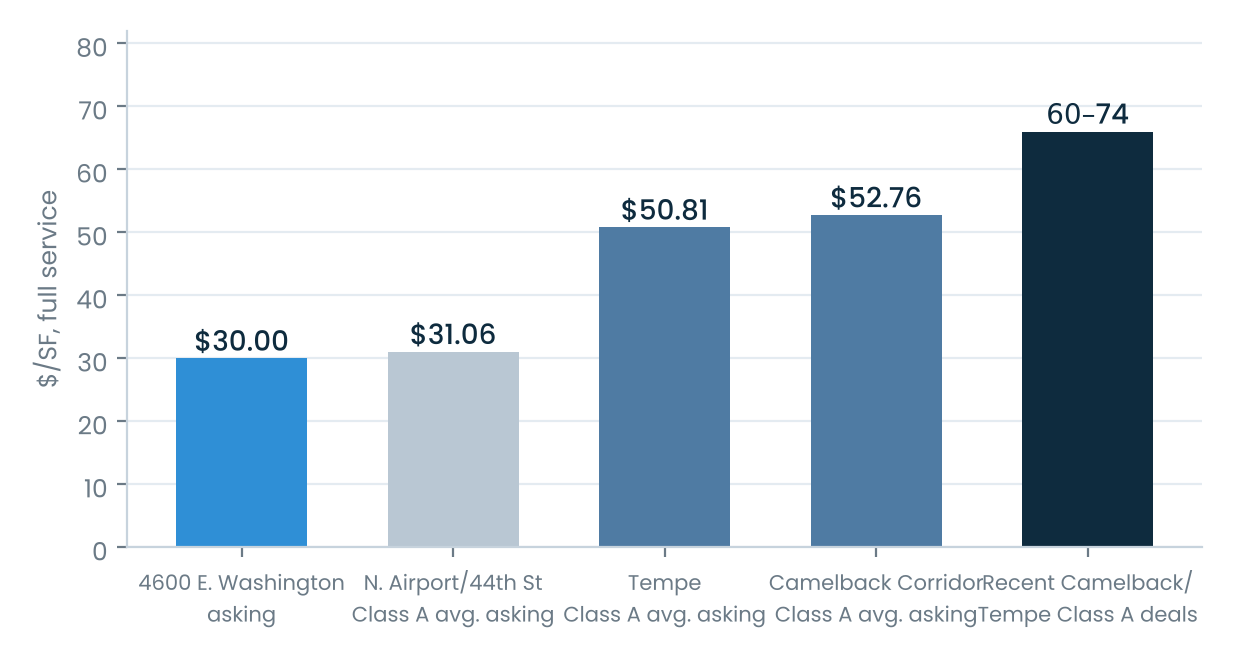
  • The demand driver: Class A asking rents of $52.76/SF in the Camelback Corridor and $50.81/SF in Tempe, with new deals negotiating in the low $70s—versus a $31.00/SF asking rate at 4600.
  • 44th Street is a straight shot to the decision-makers—Arcadia, the Biltmore and Paradise Valley—a ±6 to ±10-minute commute with no freeway required.
  • Freeway frontage and visibility on SR-143, Loop 202 three minutes away, Valley Metro light rail along the Washington Street frontage and Sky Harbor five minutes away.
  • Anchored by Valley Metro (±23,930 SF, new lease through 2036), Carollo Engineers (±39,337 SF, tenant since 2011) and Regus (through 2033)—a 4.56-year WALT on in-place leases.
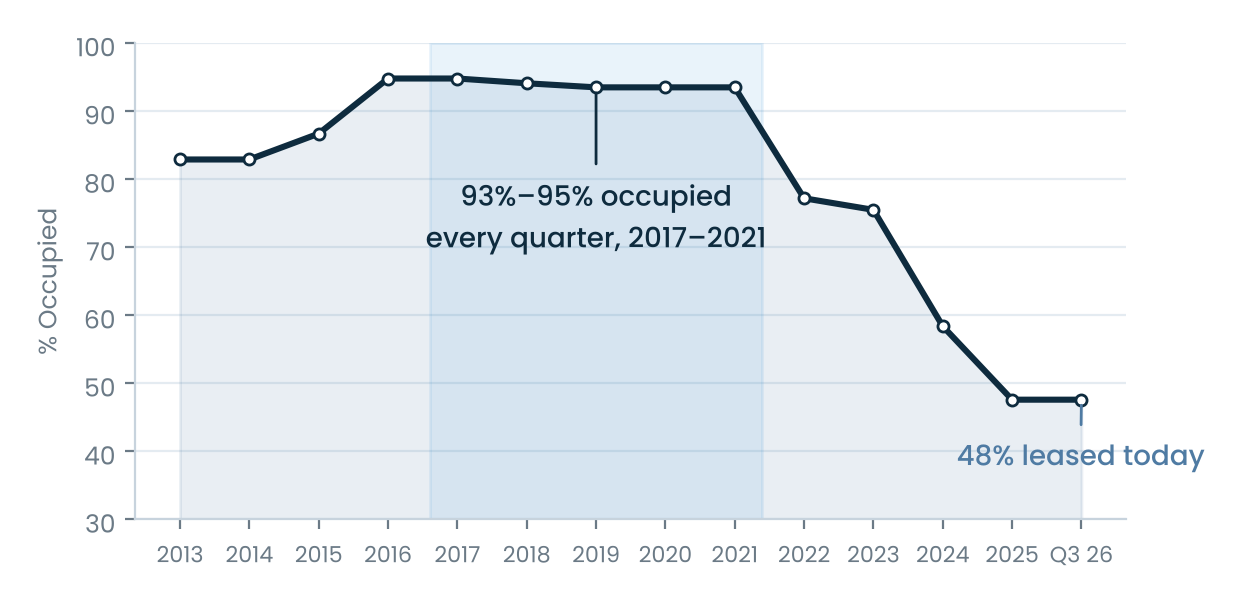
  • Proven lease-up: the building was 93%–95% occupied every quarter from 2017 through 2021.
A Class A building at a $31 rent in a $70 world.

4600 E. Washington — Offering Summary

Address4600 East Washington Street
Phoenix, Arizona 85034
Net rentable area±188,311 SF
Leased±48%
Year built2008
StoriesSix (6) • 5-level garage
Parking ratio4.15 per 1,000 SF (781 spaces)
In-place NOI (forward 12 months)$394,026
Stabilized Year 4 NOI (98.4%)$2,901,345
WALT (in-place leases)4.56 years
PriceUnpriced
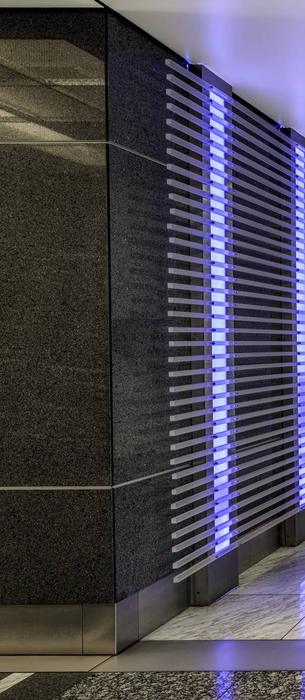
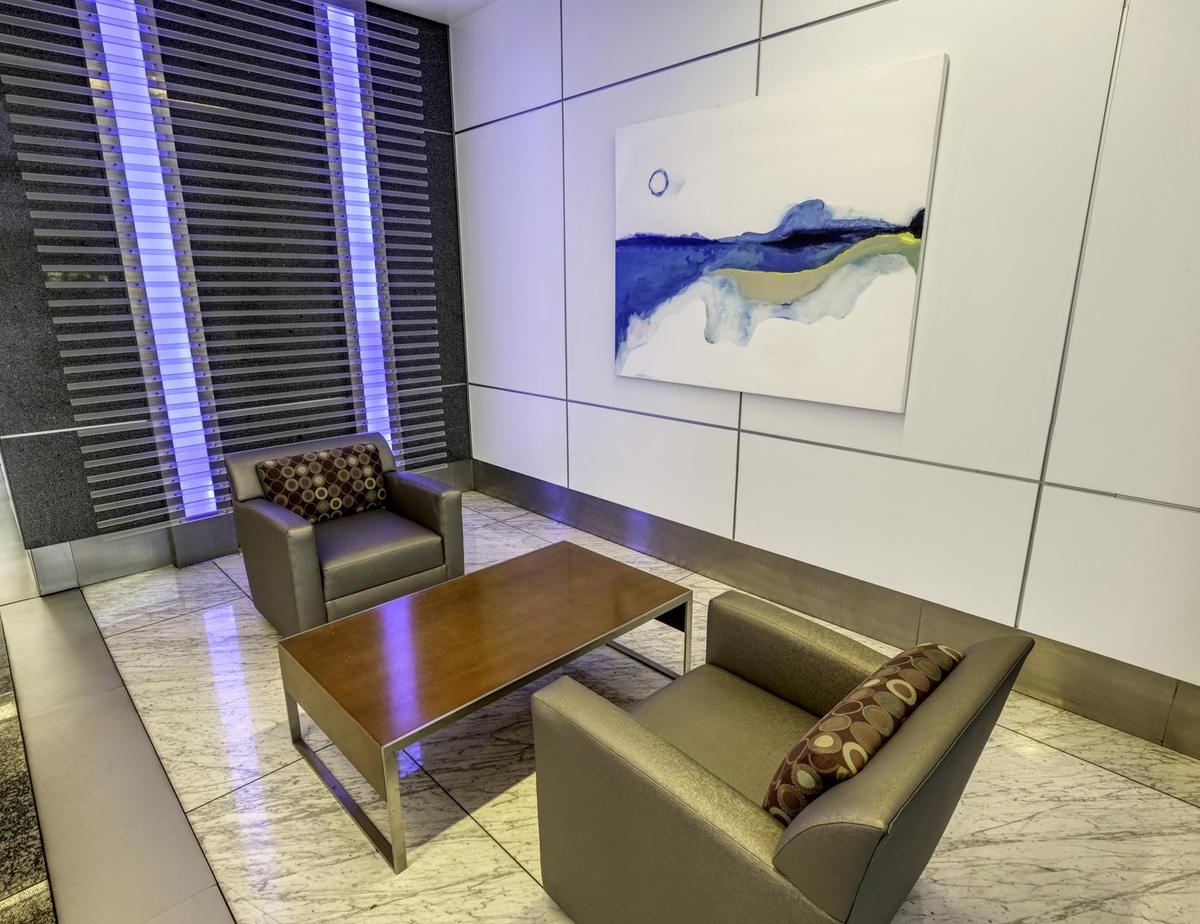
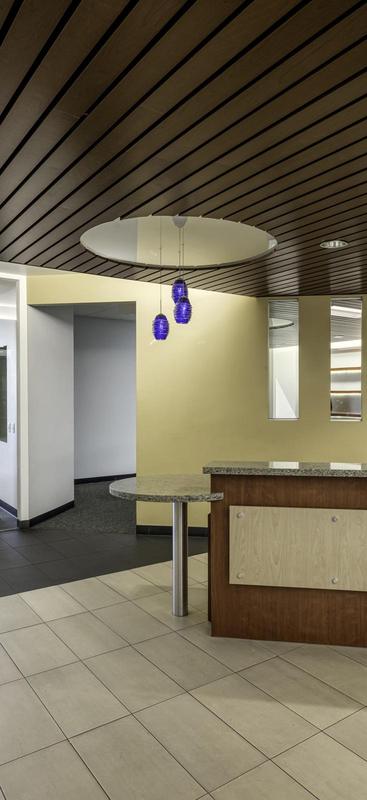
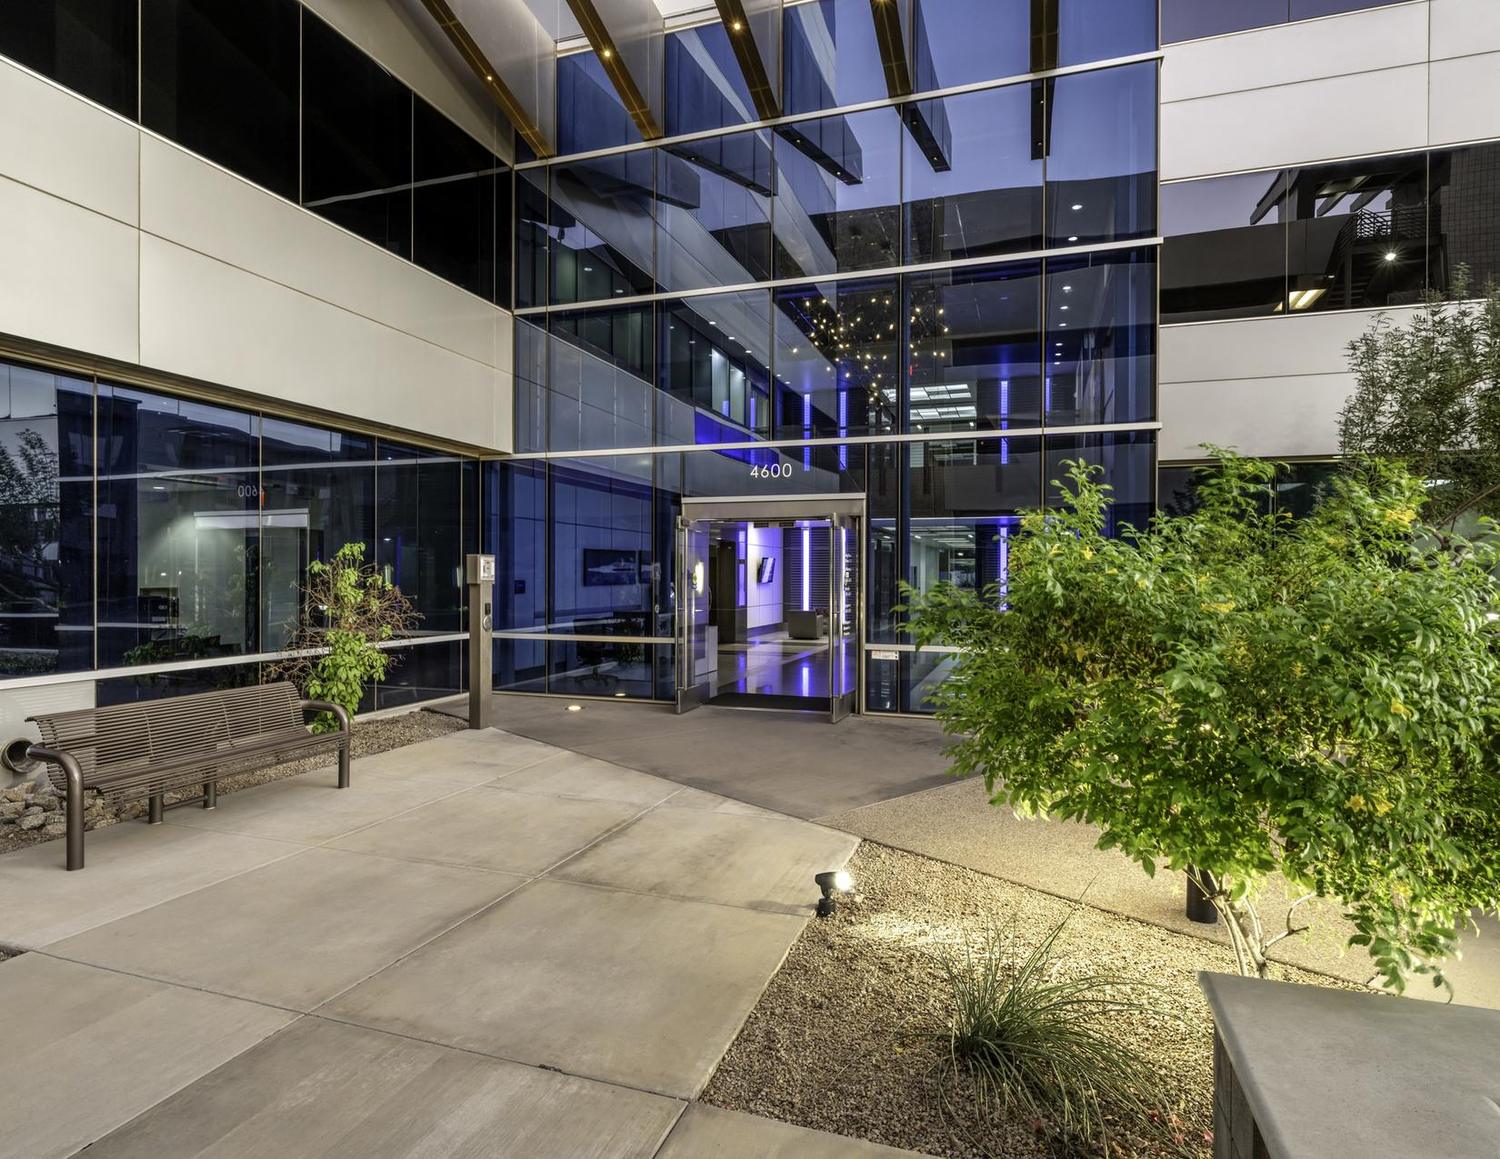
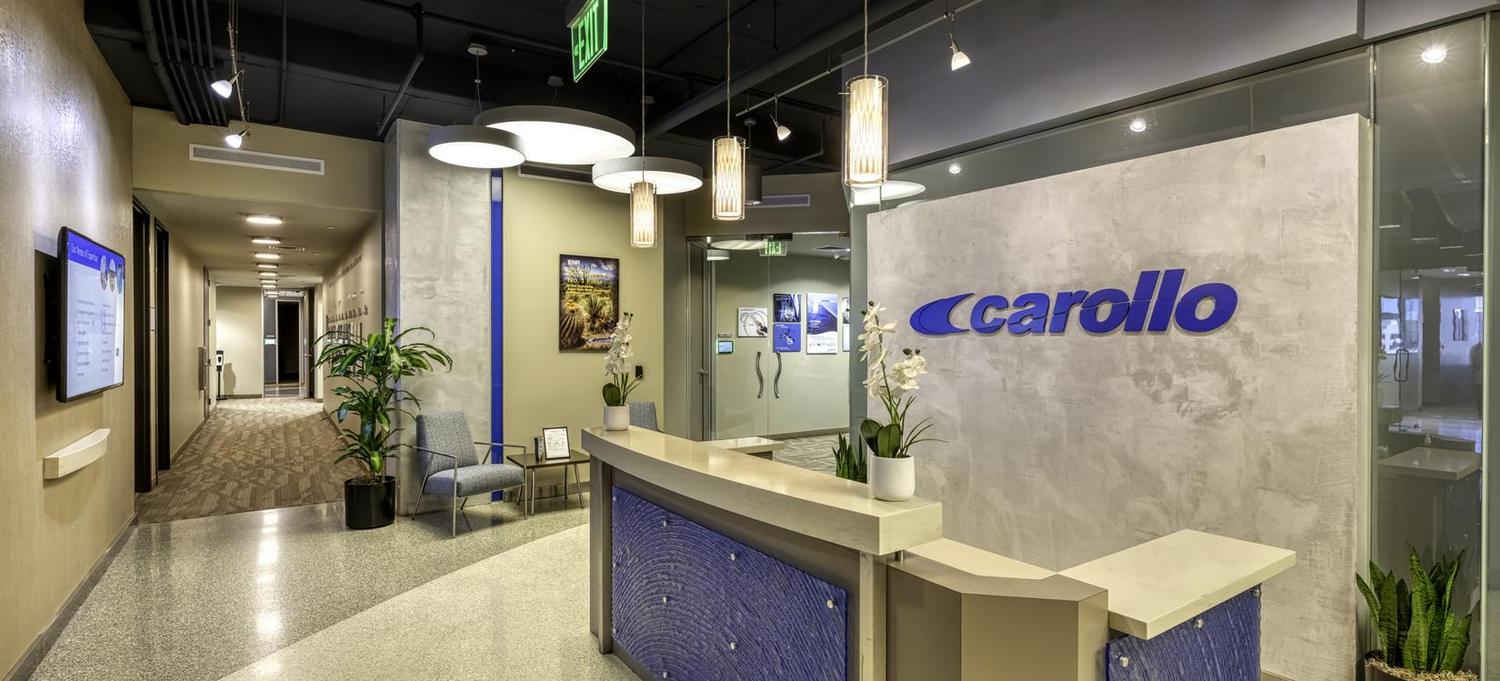
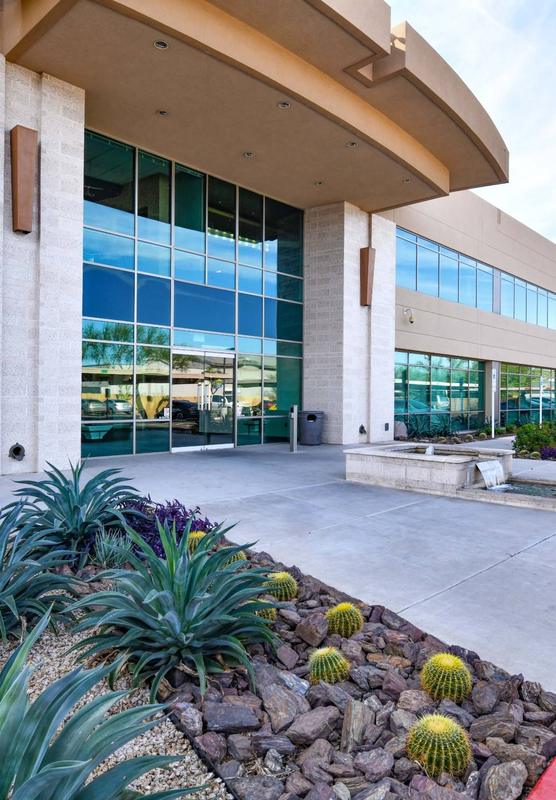
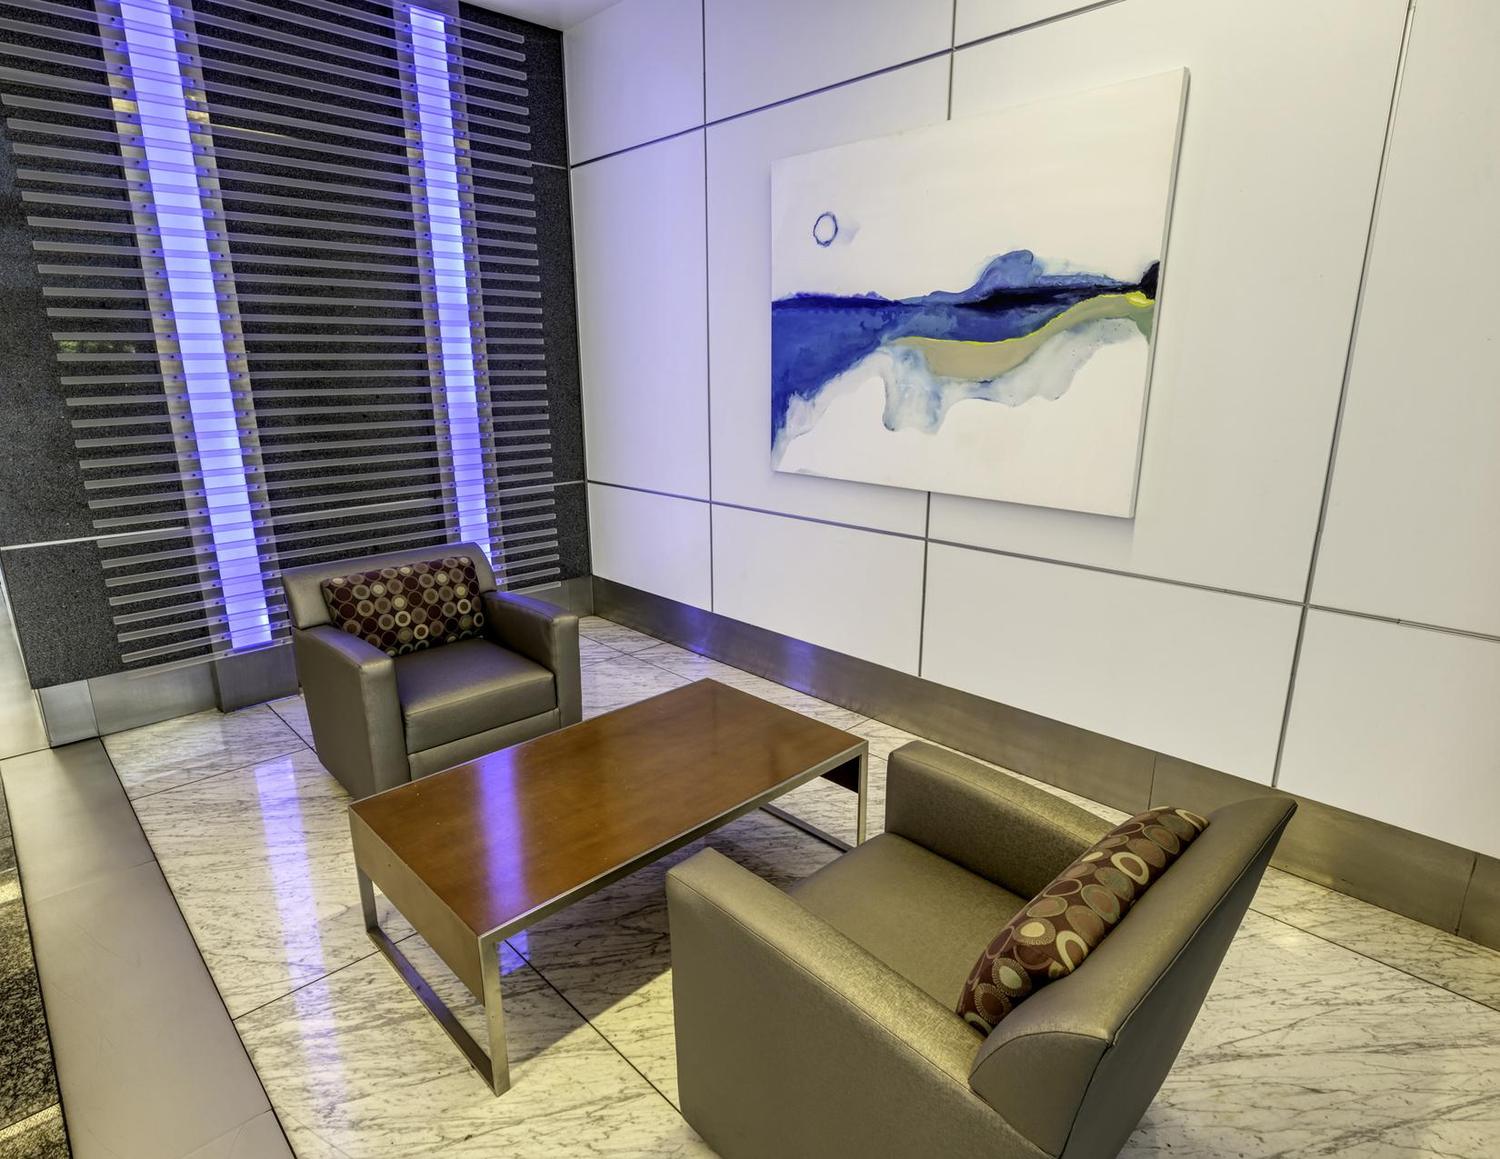
Lobby entrance with blue light panels
Contents

Jump to a section

Exclusively offered by
Private Capital Group
Eric WichtermanVice Chair
+1 602 339 3131
eric.wichterman@cushwake.com
Capital Markets
Chris TociExecutive Managing Director
+1 602 615 0999
chris.toci@cushwake.com
Office Leasing Specialists
Mike BeallExecutive Managing Director
+1 602 550 0120
michael.beall@cushwake.com
Office Leasing Specialists
Chris WalkerExecutive Managing Director
+1 480 246 6979
chris.walker@cushwake.com
01

Investment Highlights

Award-winning design · the recovery · the upside · credit anchors · the executive commute
Investment Highlights

Award-Winning Class A Design

  • NAIOP Arizona 2008 Spec Office Building of the Year and the Phoenix Business Journal's 2009 "Talk of the Town" award for best overall project.
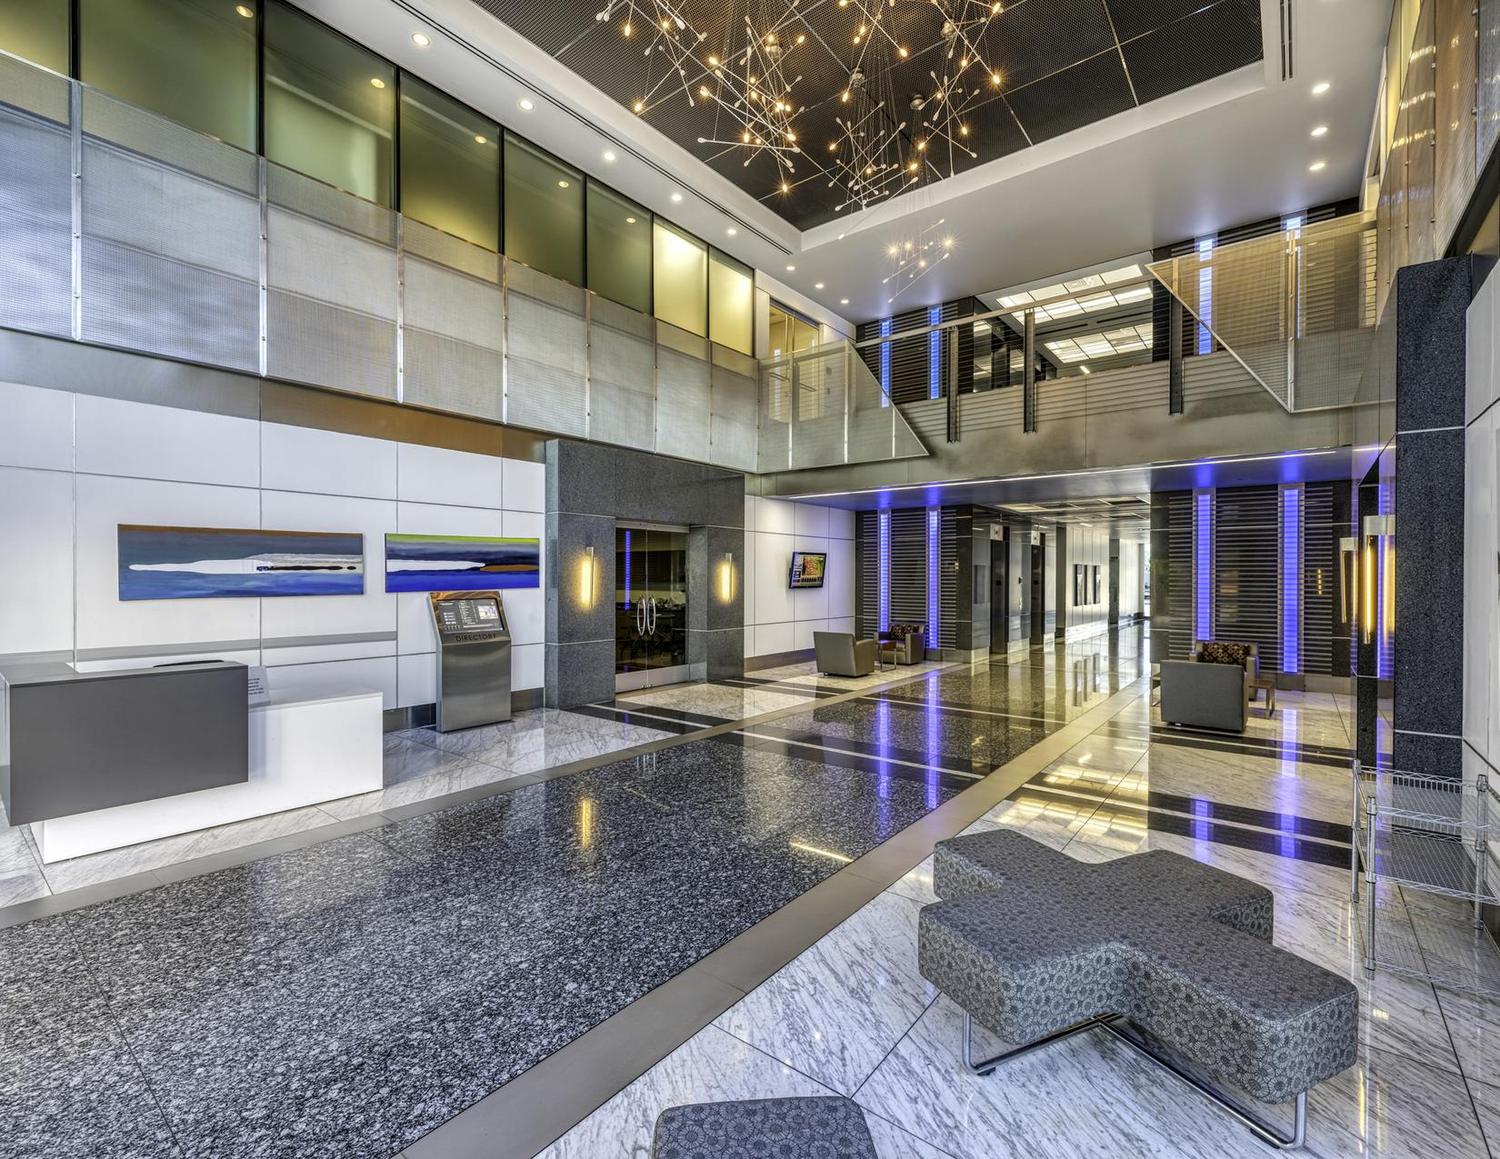
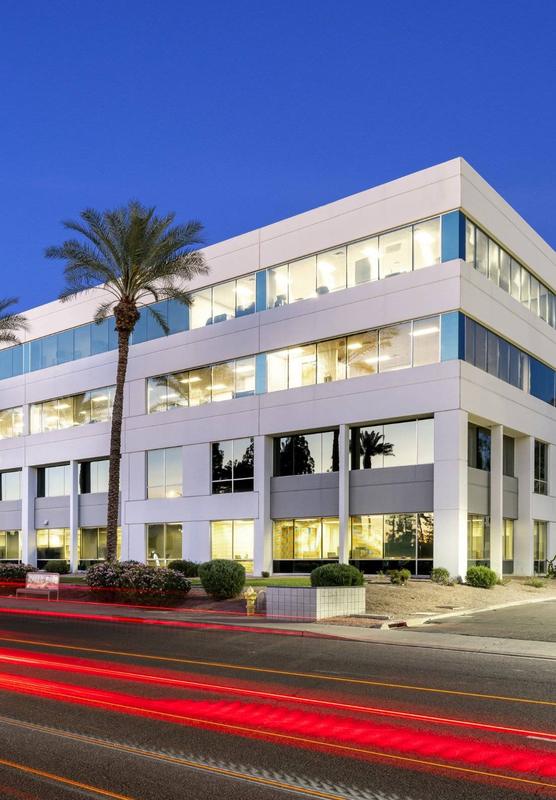
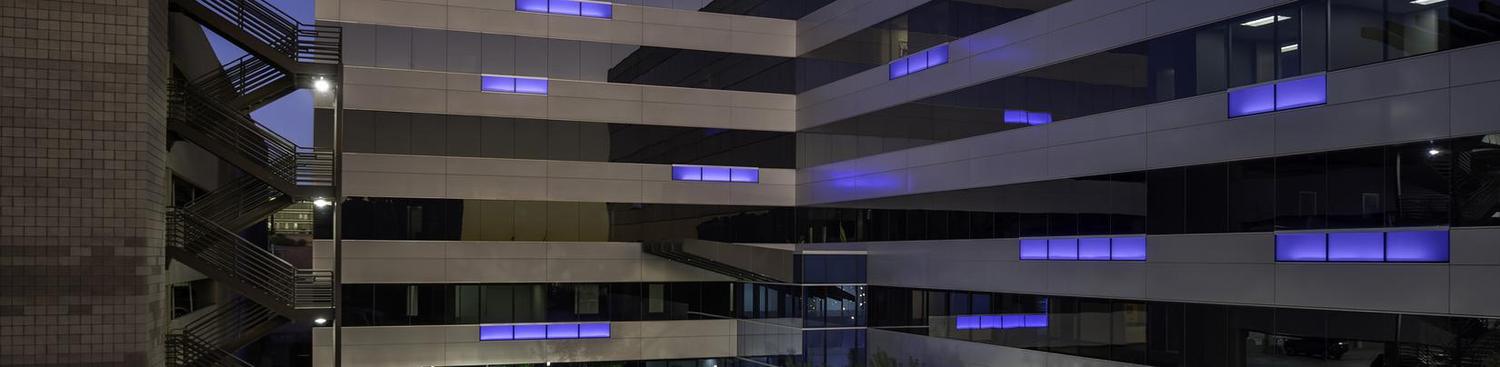
  • Distinctive architecture: two-story atrium lobby, ribbon-glass curtain wall, architectural aluminum panels and the signature blue light panels that give tenants a corporate identity visible from SR-143.
  • ±32,000 SF rectangular floor plates with efficient bay depths accommodate full-floor headquarters users as well as multi-tenant floors.
  • Post-tensioned concrete structure, three (3) gearless traction passenger elevators plus a freight elevator, and a central-plant HVAC system.
  • Covered parking in the detached five (5)-level garage—a meaningful amenity through Phoenix summers and a potential ancillary income source.
  • Upper floors offer views of Camelback Mountain, the Papago Buttes and the downtown skyline.
2008NAIOP Spec Office Building of the Year
±32,000 SFFloor plates
4.15 / 1,000Parking ratio — 781 spaces
NAIOP's Spec Office Building of the Year—built to a standard that cannot be replicated at today's construction costs.
Building exterior at dusk with blue light panels
A two-story atrium lobby, stone floors and the building's signature blue light panels—an arrival experience that sets 4600 apart from every other building in the trade area.
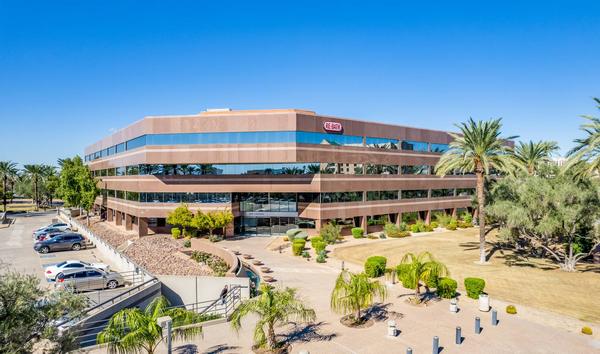
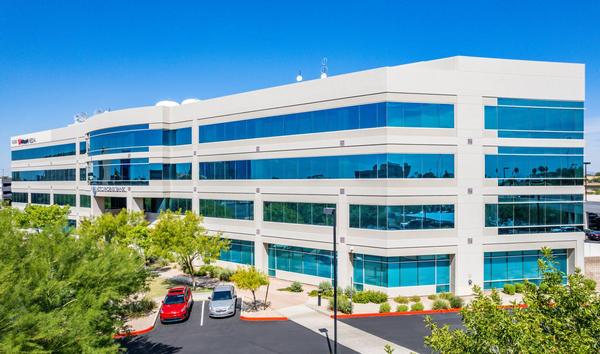
Exterior view of 4600 E. Washington
Investment Highlights

Flexible ±32,000 SF Floor Plates

  • Six floors of ±32,000 SF each—large enough for a full-floor headquarters and efficient enough to demise into half- and quarter-floor suites.
  • Existing improvements range from executive-office layouts to open-plan creative space, giving the next owner a broad spec-suite and second-generation leasing menu.
  • Floor-plate size is exactly where the market is moving: Western Alliance took 108,960 SF across two Gateway buildings because the trade area had the large blocks it needed.
  • Immediate availability of ±98,800 SF positions 4600 to capture the next large-user requirement—or several mid-sized users—without a competitor of comparable quality in the trade area.
6Floors
±32,000 SFPer floor
±98,800 SFAvailable
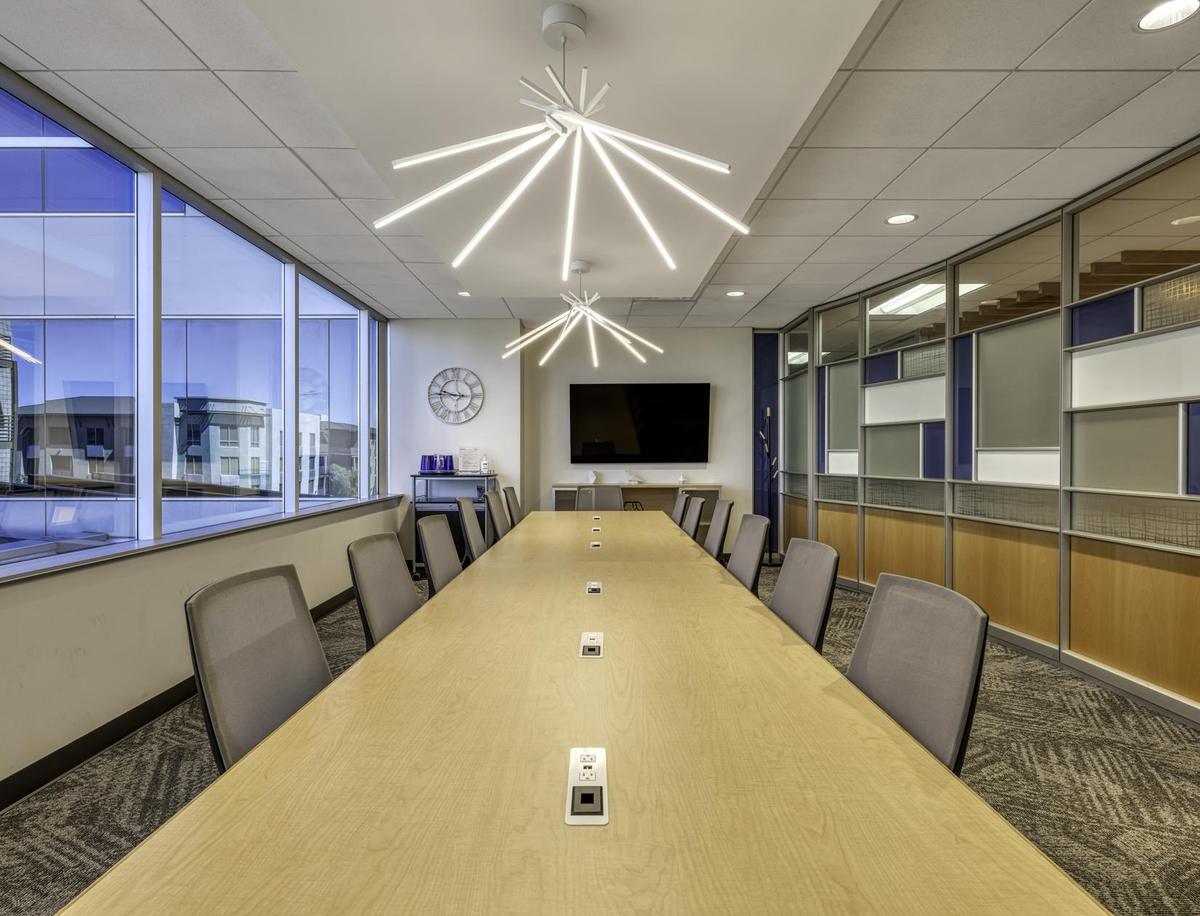
±98,800 SF available today—the largest block of Class A space in the Gateway trade area.
Open-plan office spaceExecutive office suite
Investment Highlights

A Recovery Steadily Underway

  • Western Alliance Bank leased 108,960 SF at One and Three Gateway in Q3 2026—the largest office lease in metro Phoenix for the quarter—consolidating its Phoenix-area offices into the Gateway complex it took back through foreclosure.
  • East Gateway I & II has signed ±23,000 SF in three leases since trading in late 2025—Sarku Japan Restaurant Group (14,215 SF), Trinity Consultants (6,800 SF) and a 1,966 SF renewal and expansion—with a 61,000 SF lease pending.
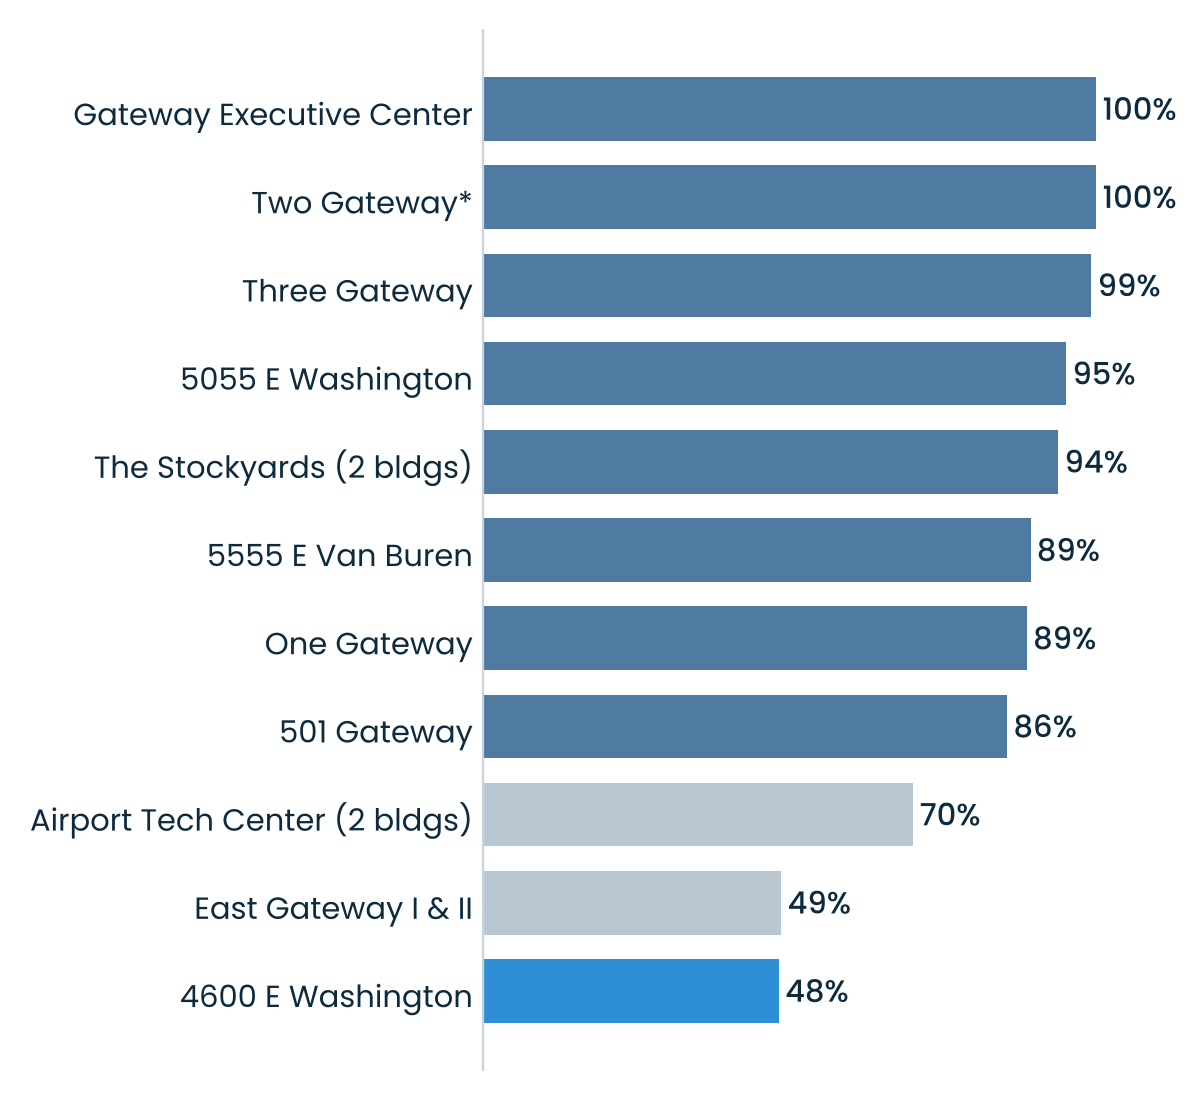
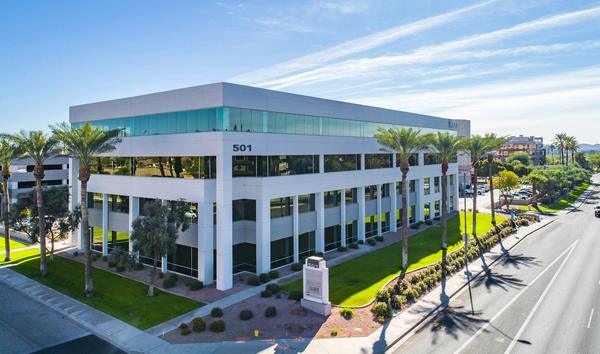
  • Gateway Executive Center (1048 N. 44th) is 100% leased; 501 Gateway is ±86% leased and just landed another ±2,500 SF tenant; 5055 East Washington is ±95% leased.
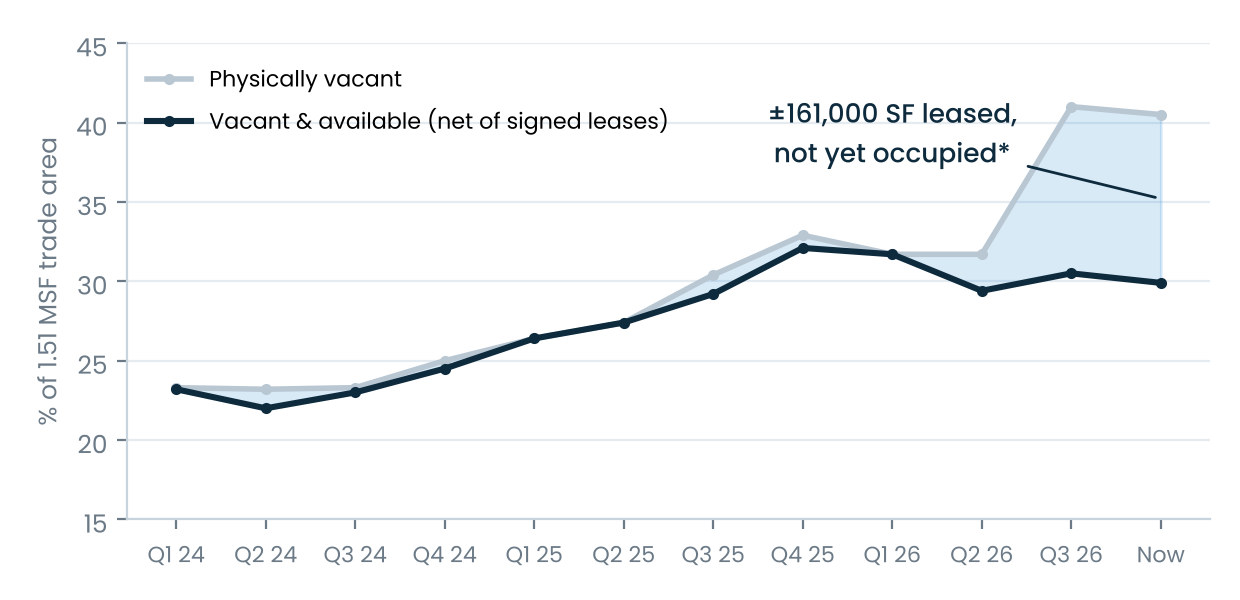
  • Across the 15-building, 1.52 MSF trade area, ±161,000 SF has been leased but not yet occupied—vacancy that CoStar still counts, and that disappears as tenants move in.
  • With that pipeline absorbed, the trade area is ±70% leased—and 4600 holds the largest contiguous block of what remains.
108,960 SFWestern Alliance lease, Q3 2026
±161,000 SFLeased, not yet occupied
The largest Valley lease of Q3 2026 landed two blocks away.

Gateway trade area — percent leased by building

Bar chart: percent leased by building; 4600 at 48%
Leased basis = RBA less vacant-available SF (net of signed leases); multi-building complexes combined. Four Gateway (100% available, owner/user offering) excluded. Source: CoStar, October 2026. *Two Gateway: 100% leased with 81,306 SF of sublease space available.
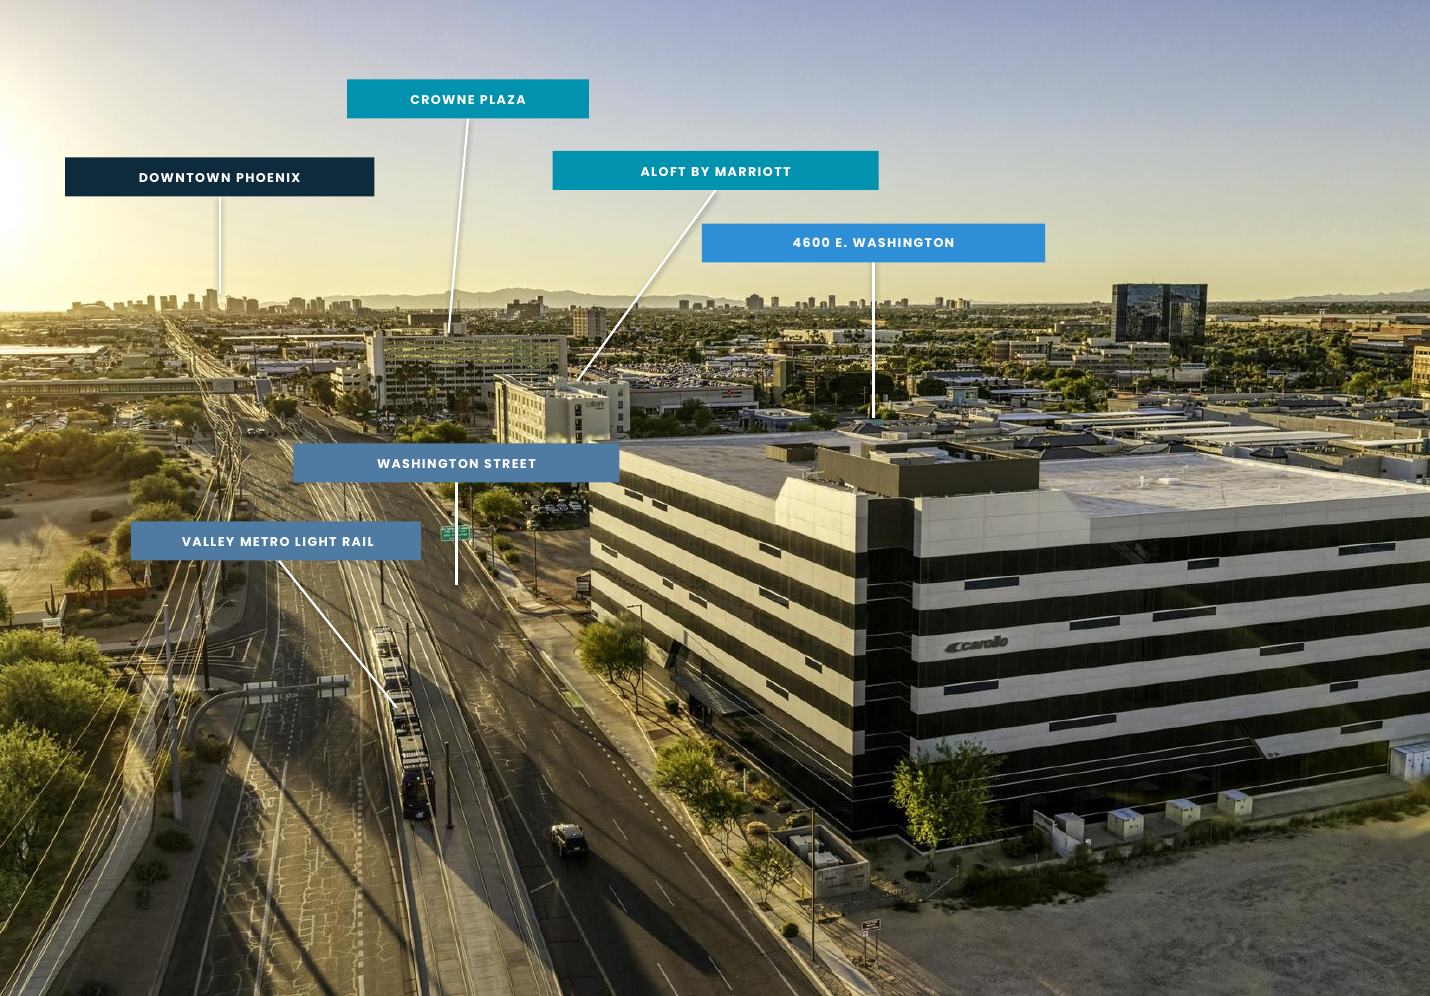
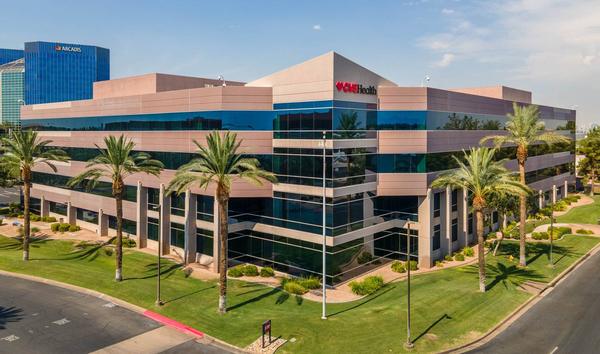
Labeled aerial looking west: 4600 E. Washington, Valley Metro light rail, Washington Street, Downtown Phoenix, Crowne Plaza and Aloft hotels
Looking west along Washington Street: light rail at the door, Downtown Phoenix on the horizon, hotels across the street.
Investment Highlights

Significant Upside Potential

  • 4600's current ±48% occupancy offers a reduced basis and the ability to grow in-place income more than seven-fold through lease-up; in-place rents sit ±10% below the $31.19/SF pro forma market rate.
  • ±98,800 SF of vacancy is contained in large, contiguous blocks—ideal for the full-floor users active in the trade area—while the floor plates demise efficiently for 5,000–15,000 SF tenants.
  • Existing improvements are extensive: executive offices, open-plan creative space, conference facilities, break rooms and lounges that lease as second-generation space with manageable capital.
  • Camelback Corridor and Tempe tenants facing renewals at more than double their 2016 rents have few Class A alternatives—Gateway, Midtown and a thin collection of buildings west of the Camelback Corridor.
  • Asking rents at 4600 are ±$31.00/SF, roughly 40% below Class A asking rents in the Camelback Corridor and Tempe and less than half the rates in recent deals there.
  • The leasing plan is already drawn: demise suite 100 into two spec suites plus a ±2,450 SF tenant amenity suite, and lease the balance to a stabilized Year 4 NOI of ±$2.90 million—more than seven times in-place.
$394,026In-place NOI
$2.90MStabilized pro forma Yr 4 NOI
7.4xNOI growth
±48% leased. ±98,800 SF available. A Class A building at a $31 rent in a $70 world.
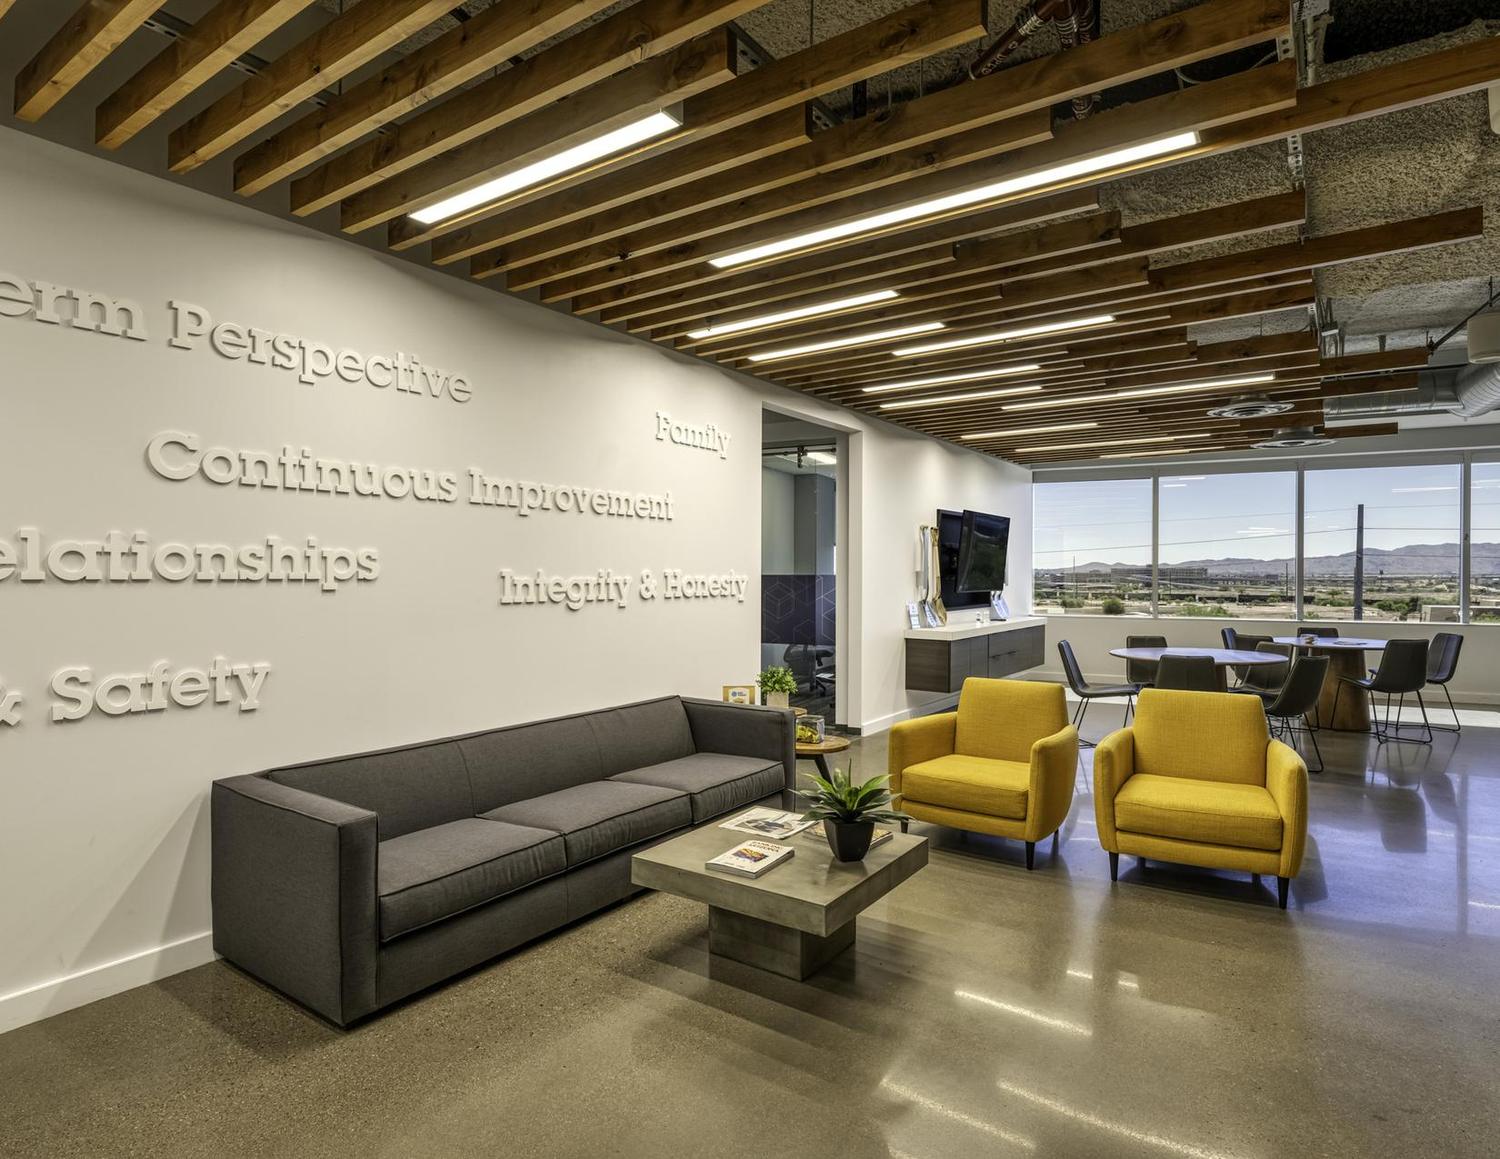
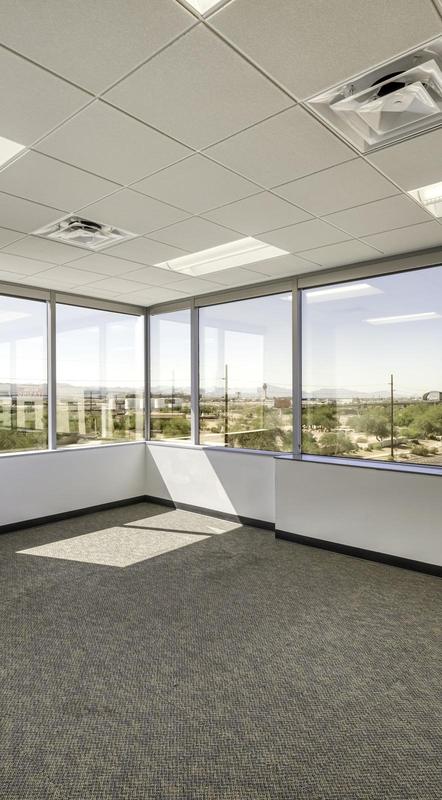
Interior office space with ribbon windows
Investment Highlights

Proven Lease-Up History

4600 E. Washington — occupancy history (year-end; Q3 2026 current)

Line chart: occupancy 2013–2026, 93–95% every quarter 2017–2021, 48% leased today
Source: CoStar All-Time Historical Vacancy Report, September 25, 2026.
  • 4600 was 93%–95% occupied every quarter from 2017 through 2021—twenty consecutive quarters of near-full occupancy.
  • The vacancy that exists today arrived in three post-COVID move-outs (2022, 2024 and 2025) and the absence of an offensive leasing strategy, not from any shortcoming of the building.
  • The building has already leased up once—from a 2008 spec delivery into the recession to ±95% occupancy—and the trade area is now re-tenanting once again.
Building exterior with garage
Investment Highlights

Long-Term Credit Anchors

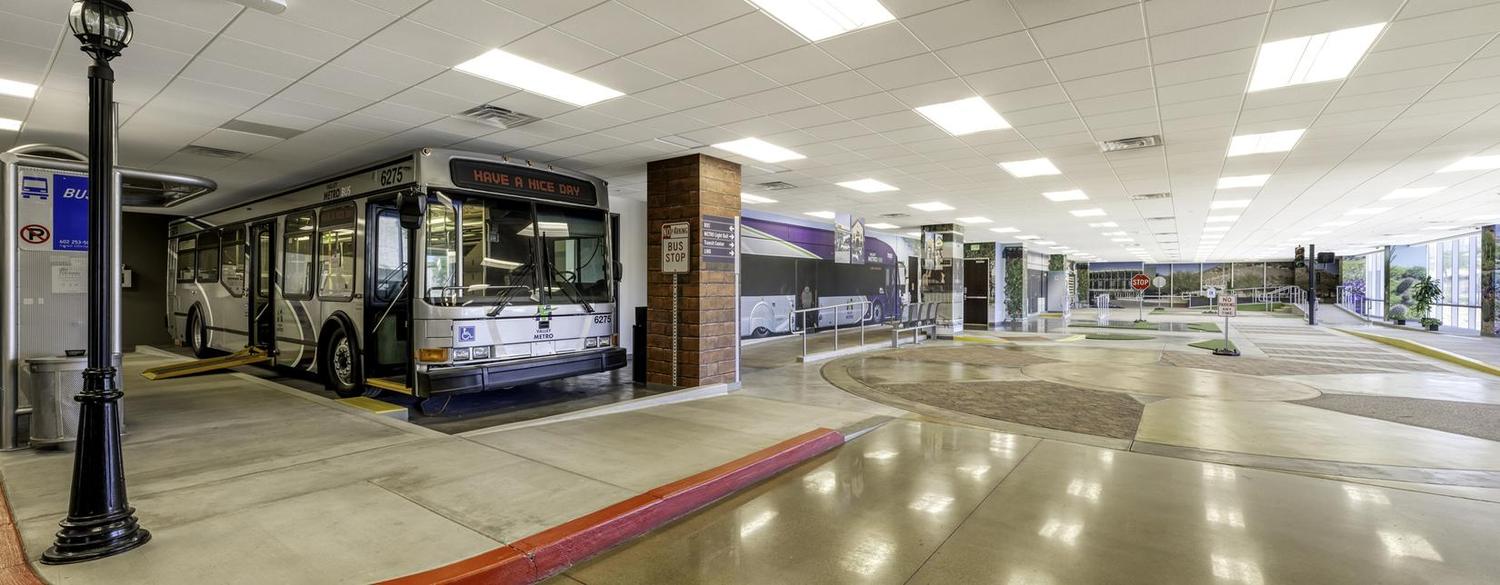
  • Valley Metro Regional Public Transportation Authority—tenant since 2011—just signed a new ten-year lease through June 2036 on ±23,930 SF, with rent commencing January 2027.
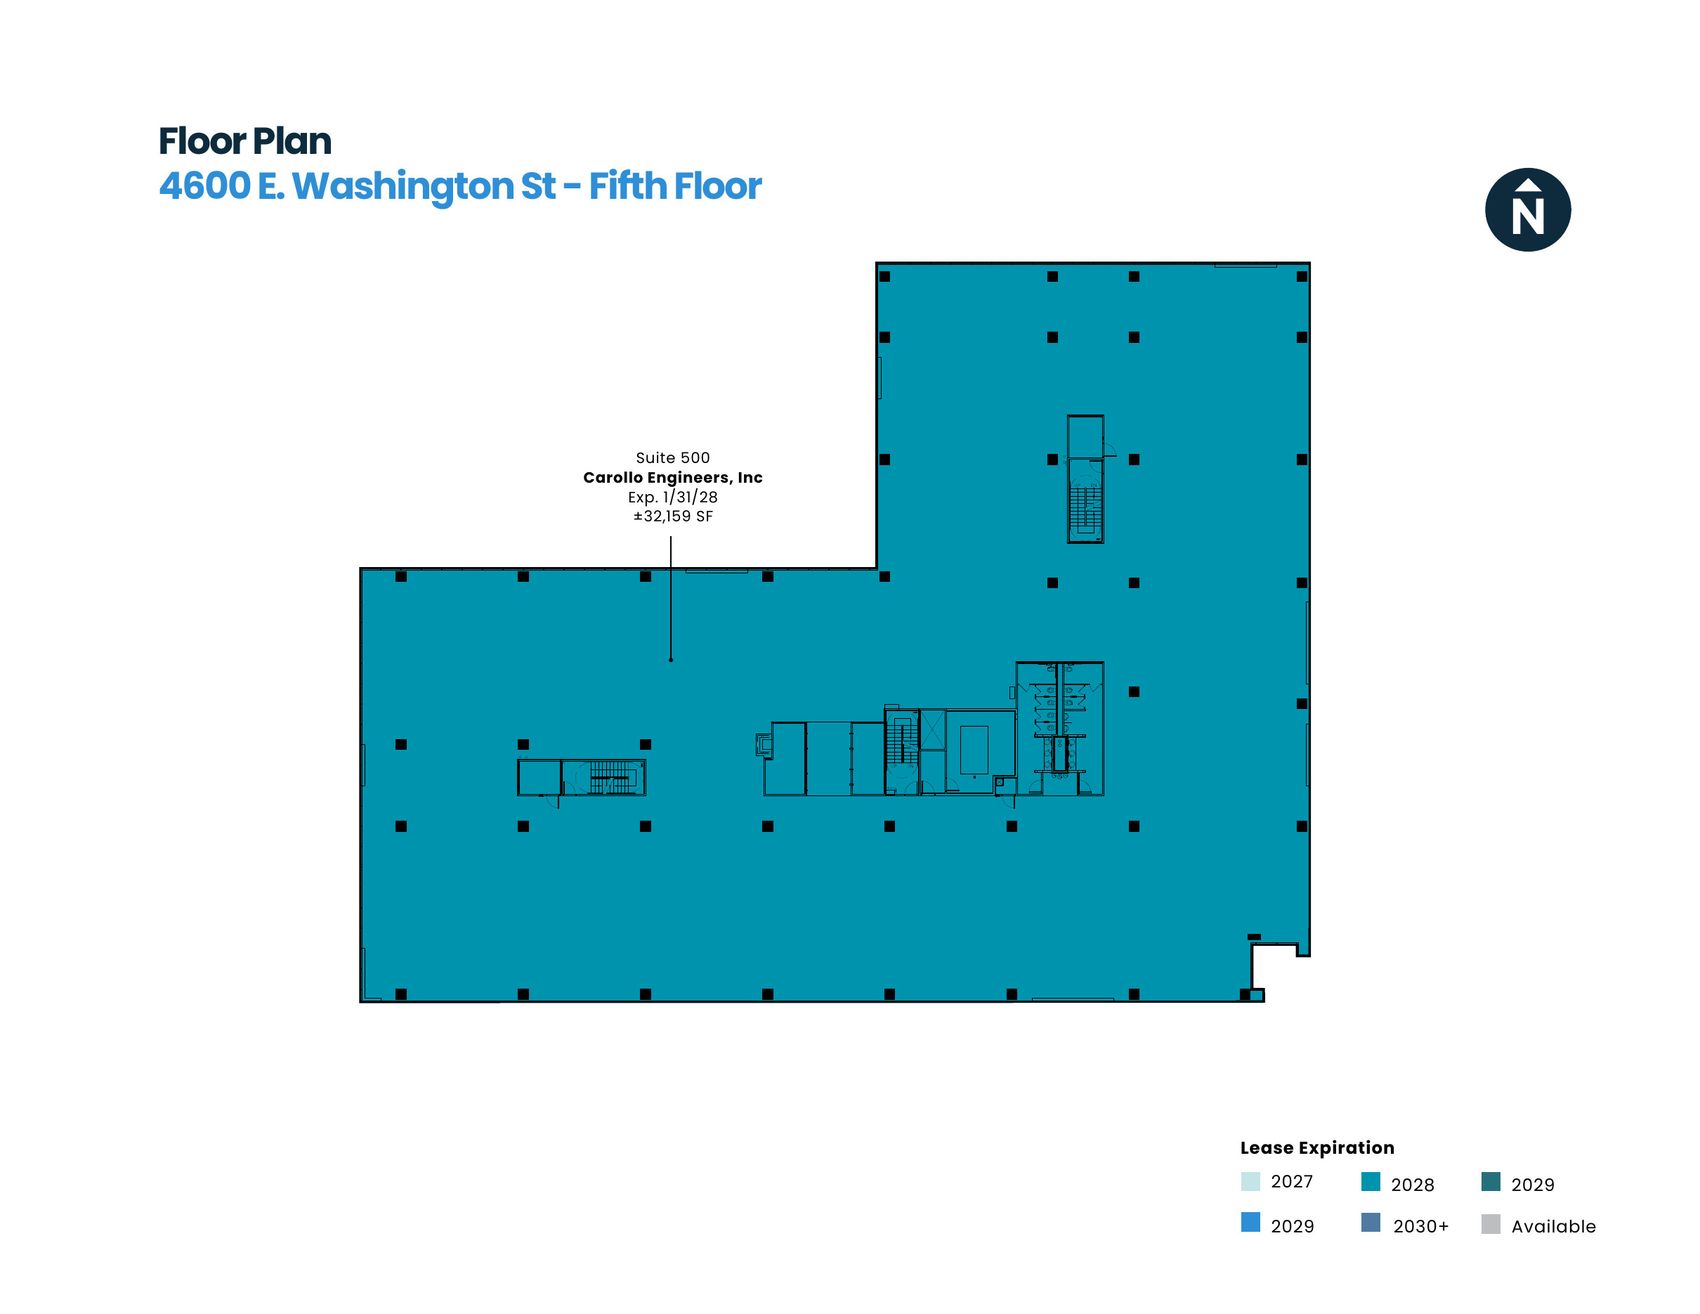
  • Carollo Engineers, one of the nation's leading water-focused environmental engineering firms, has occupied the entire ±32,159 SF fifth floor plus a fourth-floor suite (±39,337 SF total) since 2011.
  • Regus (IWG) operates a ±15,339 SF flexible-workspace center on the third floor under a lease running to January 2033—a tenant since 2012.
  • Graycor Construction rounds out a roster with an average tenure of over a decade and a 4.56-year weighted average lease term.
  • Nothing rolls in 2027; with Graycor's pending renewal to 2032, the only expiration before 2033 is Carollo's in January 2028.
Valley Metro through 2036. Carollo since 2011. A decade of tenure in the building.
Valley Metro RPTASuites 101 / 315±23,930 SFExp. 6/2036Tenant since 2011
Carollo Engineers, Inc.Suites 500 / 450±39,337 SFExp. 1/2028Tenant since 2011
Regus (RGN-Phoenix II)Suite 300±15,339 SFExp. 1/2033Tenant since 2012
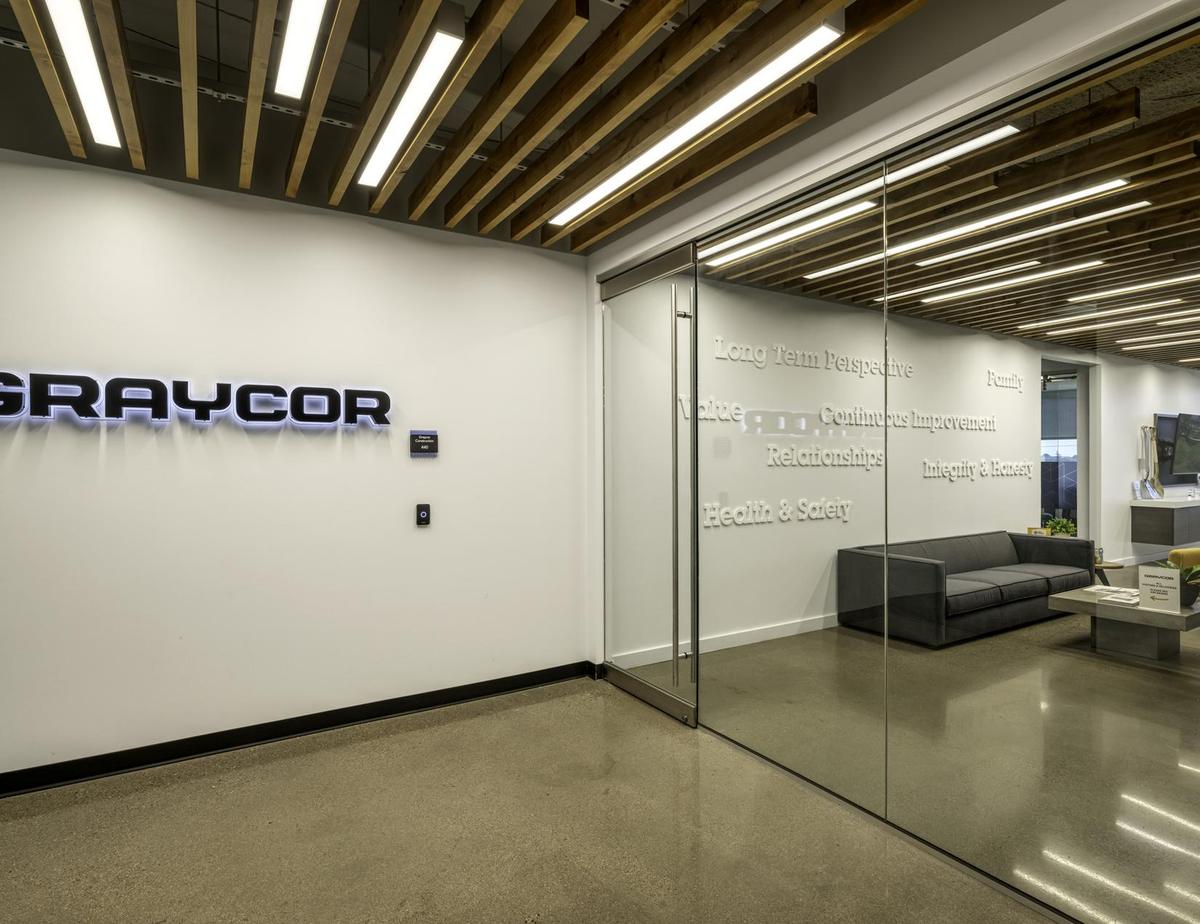
Graycor ConstructionSuite 440±7,958 SFExp. 8/2032Tenant since 2016

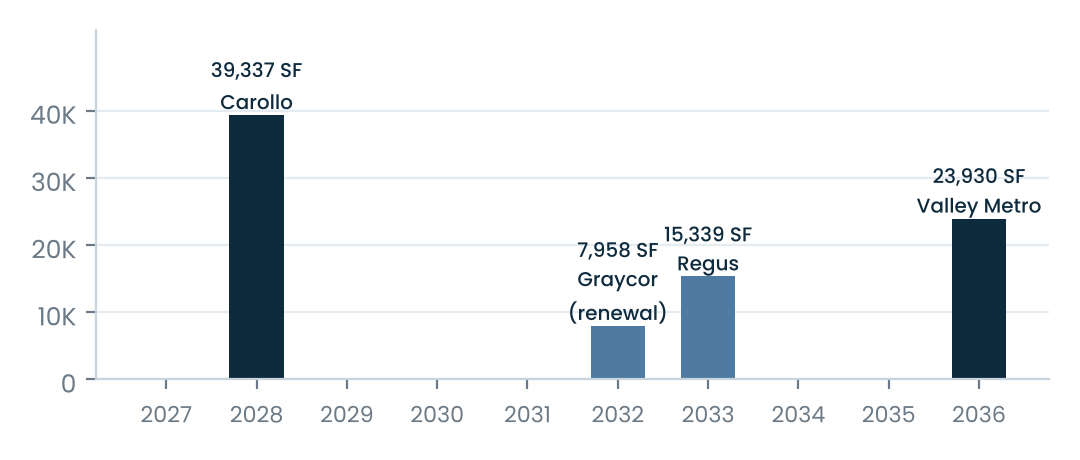
In-place lease expirations (SF by year)

Bar chart of lease expirations: Carollo 2028, Graycor 2032, Regus 2033, Valley Metro 2036
±48% of the building is leased long-term; the in-place roll is light and staggered—2028 (20.9%, Carollo), 2032 (4.2%, Graycor renewal), 2033 (8.1%) and 2036 (12.7%). Nothing expires 2029 through 2031.
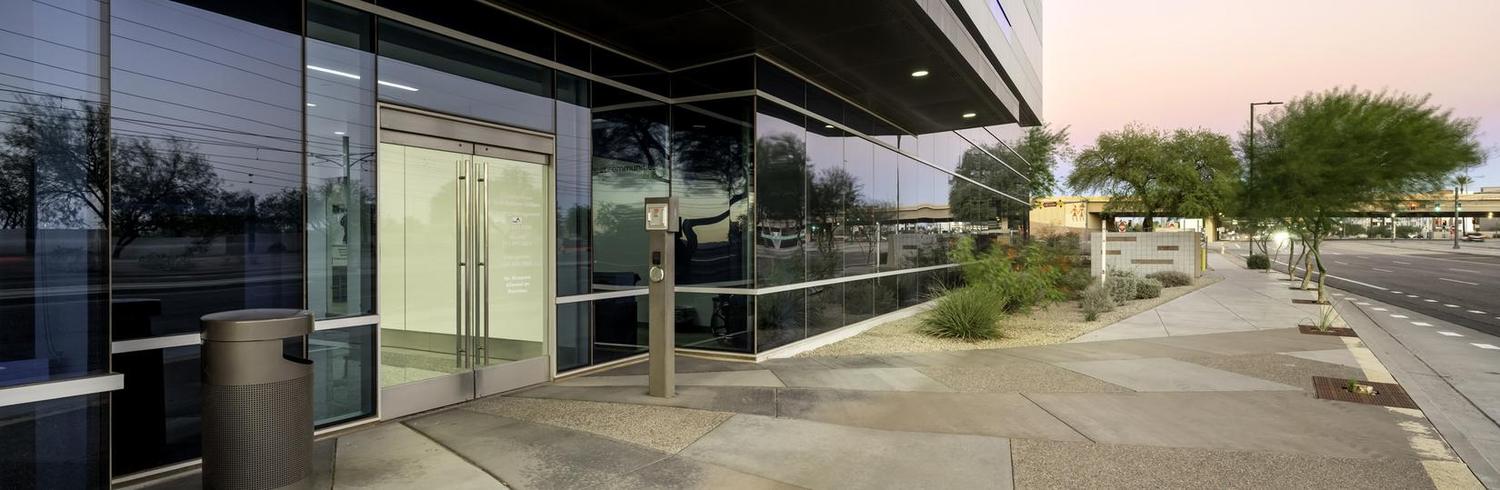
Exterior of 4600 E. Washington from Washington Street
Investment Highlights

The Camelback & Tempe Squeeze

  • Just three years ago premier Class A office in the Camelback Corridor leased at ±$45/SF; deals in negotiation today are firmly in the low $70s.
  • Ten years ago tenants secured Camelback Corridor rates in the mid-to-high-$20s—those tenants now face a more than doubling of their rent at renewal.
  • Class A asking rents stand at $52.76/SF in the Camelback Corridor and $50.81/SF in Tempe, against $31.06/SF in the North Airport/44th Street Corridor (C&W Research, Q3 2026).
  • The alternatives for a Camelback or Tempe tenant are few: Gateway, Midtown/Downtown North, and a thin collection of off-the-beaten-path buildings along 7th Street, 16th Street, Missouri and Northern.
  • Of those, only Gateway keeps the executive commute short—44th Street runs straight south from Arcadia, the Biltmore and Paradise Valley to the subject's front door.
Camelback tenants are negotiating in the low $70s. 4600 asks $31.

Class A rent gap — $/SF full service

Bar chart: 4600 asking $30 vs. corridor, Tempe, Camelback and recent deals

Recent Camelback Corridor & Tempe Class A leases

BuildingTenantSFRate
Bond (3200 E Camelback)One Capital Mgmt2,127$74.16
Arbor Old TownSerhant1,602$71.16
Camelback Esplanade VFisher & Phillips9,896$70.00
Bond (3200 E Camelback)Montana Comm. Credit1,804$68.18
Bond (3200 E Camelback)WFG National Title3,715$67.00
Camelback Esplanade VMajestic Realty3,048$66.00
Camelback Esplanade IRyan Transportation21,067$65.00
Camelback Esplanade VBDO11,762$65.00
Camelback Esplanade IIPolsinelli17,826$64.00
Arbor (51 W 3rd St, Tempe)Personify Health18,237$63.50
Full-service base rents, leases signed October 2025–September 2026. Source: CoStar lease comps, October 2, 2026.
Investment Highlights

The 44th Street Spine

  • 44th Street is the Gateway trade area's main arterial—and it runs straight south from the Valley's densest concentration of decision-makers.
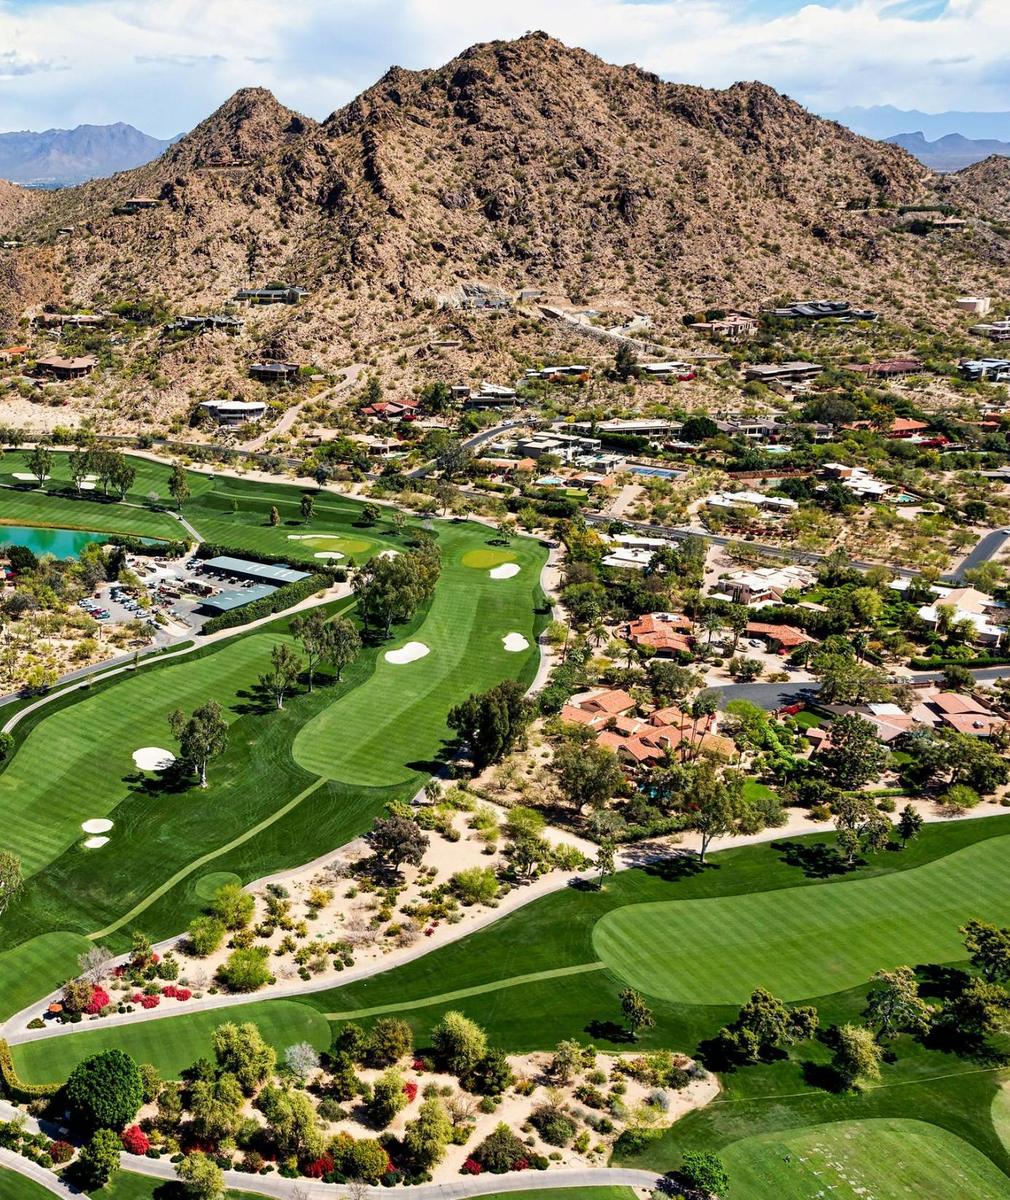
  • To the north it becomes Tatum Boulevard, cutting through the center of Paradise Valley—a town of one-acre-minimum lots with no commercial zoning, a $4.2 million median home price and sales reaching $33 million.
  • Because of the mountains, Paradise Valley can otherwise be exited north-to-south only via SR-51 or Scottsdale Road—44th/Tatum is the direct link through the Phoenix Mountain Preserve, and Gateway is a straight ±10-minute commute.
  • 44th Street also cuts through Arcadia to the east and Arcadia Lite and the Biltmore to the west—the balance of the nearby executive housing.
  • Moving an office from the Camelback Corridor to any other alternative means a longer, less convenient commute. Gateway shortens it.
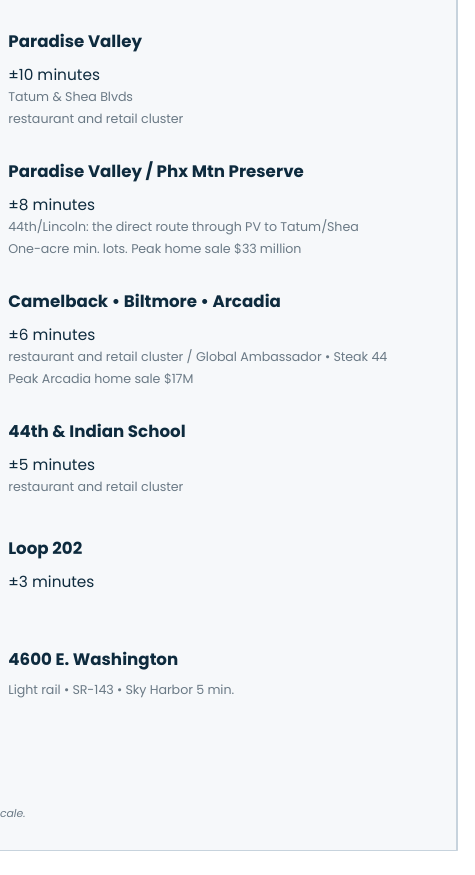
Paradise Valley to the front door in ±10 minutes—no freeway required.

44th Street / Tatum Boulevard — the executive commute

Schematic of the 44th Street commute: Paradise Valley ±10 min, Preserve ±8, Camelback/Biltmore/Arcadia ±6, 44th & Indian School ±5, Loop 202 ±3, 4600
Investment Highlights

The Wealth Belt

  • 4600 sits at the foot of a corridor of three of the Valley's most affluent residential pools—Paradise Valley, Arcadia and Arcadia Lite—and 44th Street runs straight through all three.
  • Paradise Valley is a 15-square-mile town of ±5,700 homes on one-acre-minimum lots weaving through Mummy Mountain and the Camelback foothills, with no commercial zoning. Its median home price is ±$4.2 million, and sales have reached $33 million.
  • Arcadia and Arcadia Lite (44th to 68th Street and 32nd to 44th Street, Camelback Road to the canal and Indian School) cover roughly four square miles of citrus-grove estates. Arcadia sales have reached $17 million; the ±$1.1 million median understates values because most trades are older homes bought for their land and replaced by the new estates under construction across the neighborhood.
  • Together they form the executive housing and white-collar labor pool for the Camelback Corridor—and 4600 is a six-to-ten-minute, no-freeway commute from all of it.
Paradise Valley's median home is $4.2 million. The office is ten minutes down the street.
Paradise Valley estate at the foot of Camelback Mountain
Three affluent pools. One straight street. A six-to-ten-minute commute.
Investment Highlights

Amenities Up 44th Street & in Downtown Tempe

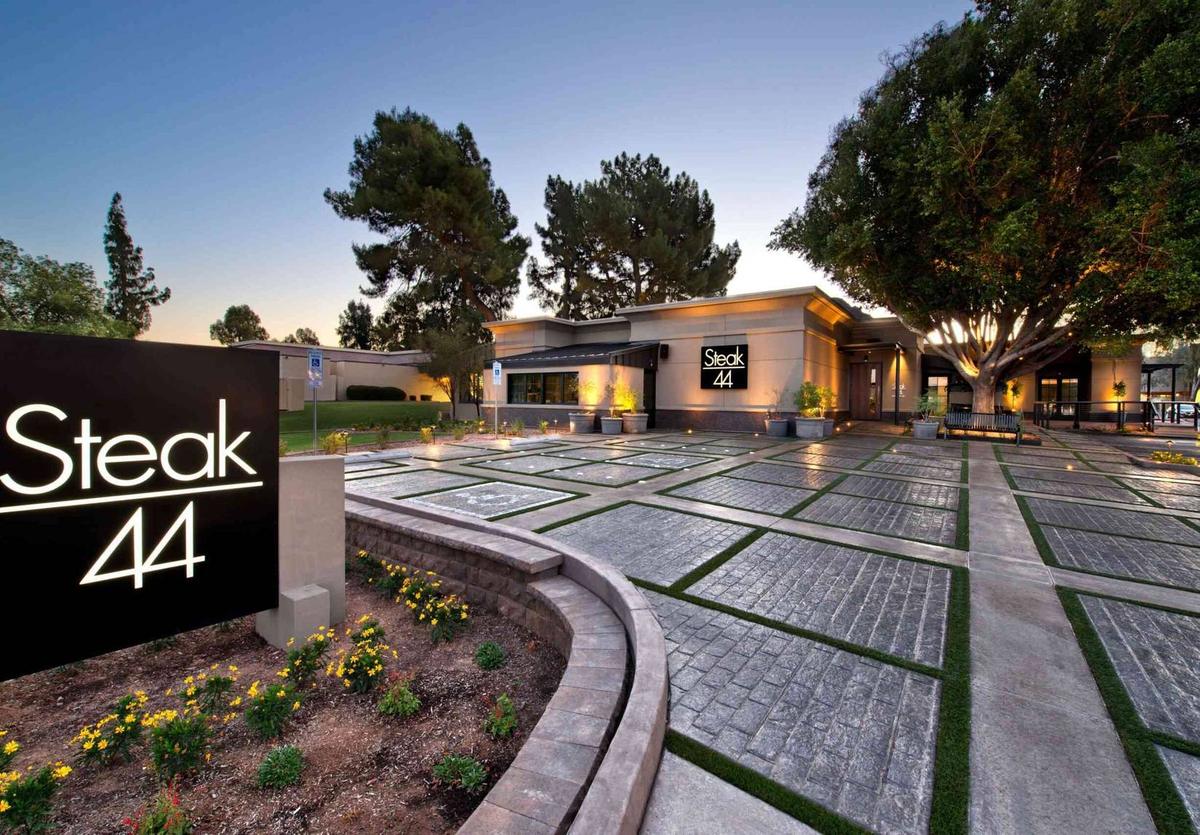
  • Minutes north on 44th Street, the 44th & Camelback node is one of the Valley's premier dining and hospitality addresses—anchored by The Global Ambassador hotel (with its three upscale restaurants and a private club), Steak 44, Pyro, LaLa Land, Flower Child and The Henry—with the Camelback Corridor's restaurants and retail beyond.
  • 44th & Indian School adds a second dense cluster on the way to Arcadia—Doughbird, Hash Kitchen, Sushi Brokers, Nook Kitchen, Pita Jungle and CAVA.
  • Closer in, the 44th & Washington light rail station and PHX Sky Train put Sky Harbor, Downtown Tempe and Downtown Phoenix within minutes—Tempe's Mill Avenue is ±8 minutes by car or rail.
  • Downtown Tempe is home to the nation's largest university, Arizona State University, and its famed Mill Avenue Entertainment District is packed with nightlife, restaurants (Roman God of Fire, Filthy Animal, Culinary Gangster), and upscale hotels.
  • Hotels cluster around the airport and 44th Street for visiting clients and executives, and Papago Park, the Phoenix Zoo and the Desert Botanical Garden lie just north.
The Global Ambassador (its three restaurants), Steak 44, Pyro and LaLa Land—minutes up 44th Street.
The Global Ambassador hotel at 44th and Camelback

Nearby dining & hospitality (selected)

44th & Camelback / Arcadia44th & Indian SchoolDowntown Tempe
The Global AmbassadorDoughbirdArizona State University (ASU)
Steak 44Hash KitchenTempe Town Lake
PyroSushi BrokersFilthy Animal
LaLa LandNook Kitchen ArcadiaRoman God of Fire
The HenryPita JungleCulinary Gangster
Flower ChildCAVACafé Boa
Investment Highlights

Transit-Oriented Location

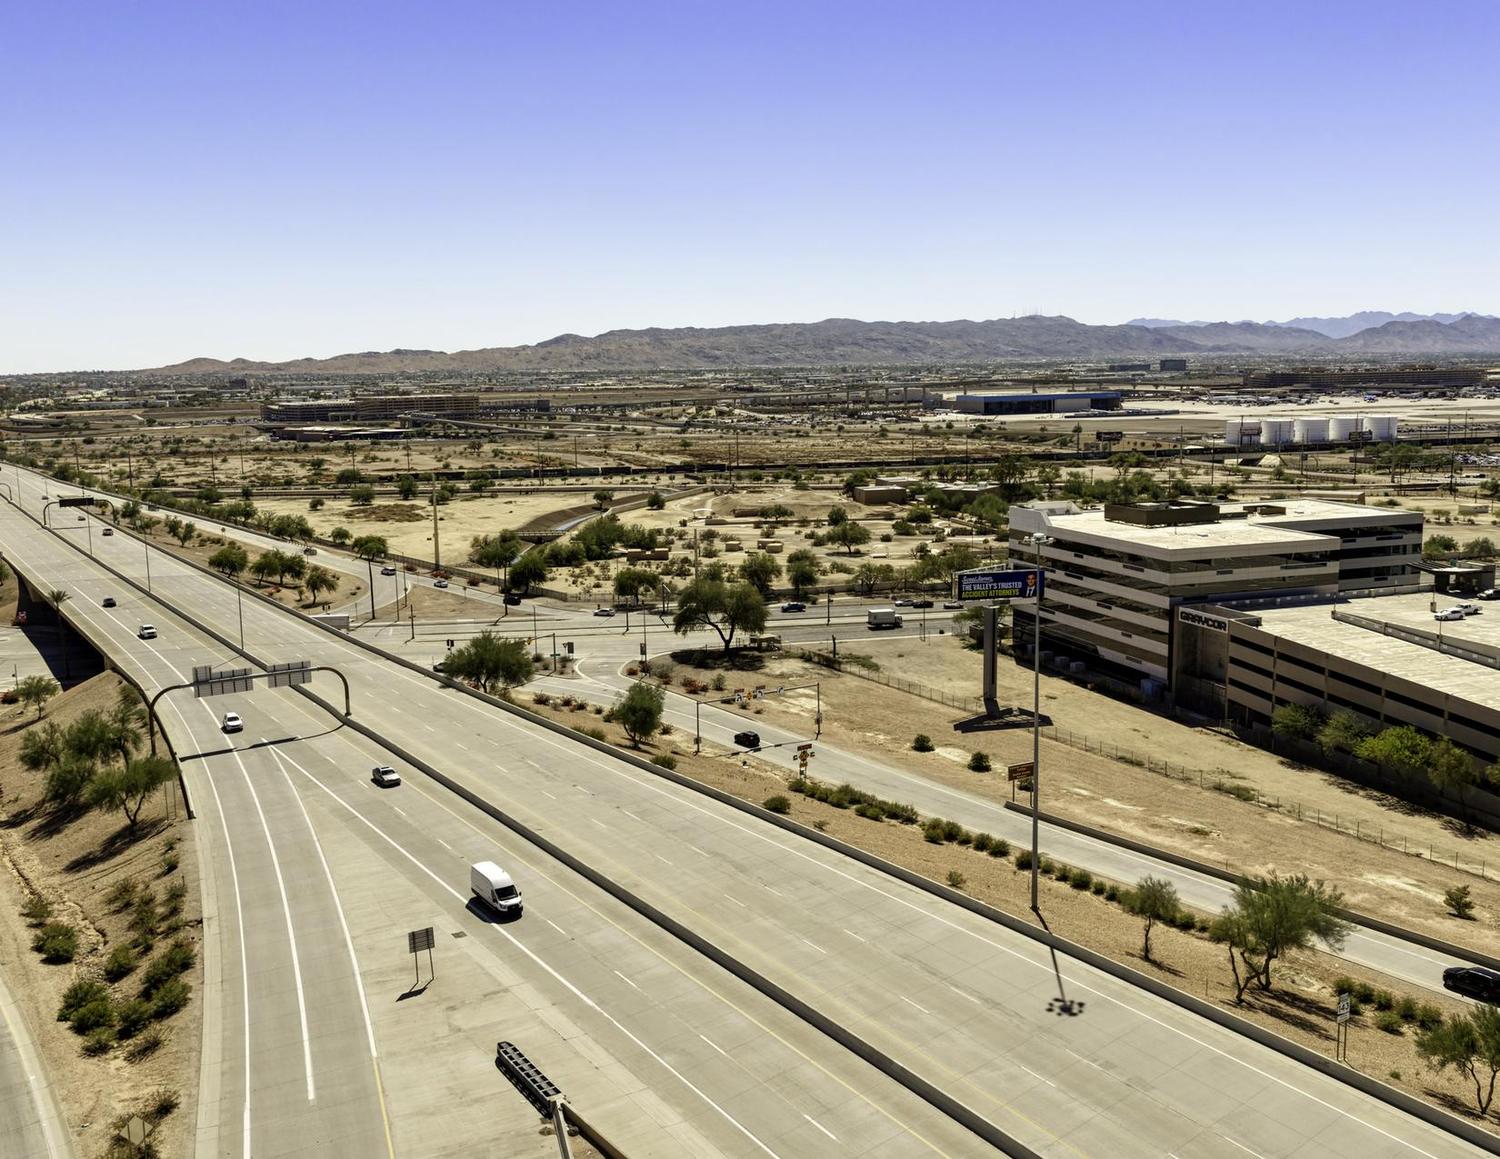
  • Frontage and visibility on SR-143, the Hohokam Expressway—direct to the Loop 202, I-10 and US-60.
  • Loop 202 is three minutes away, from which virtually every Valley freeway can be reached, including the Loop 101, SR-51 and I-17.
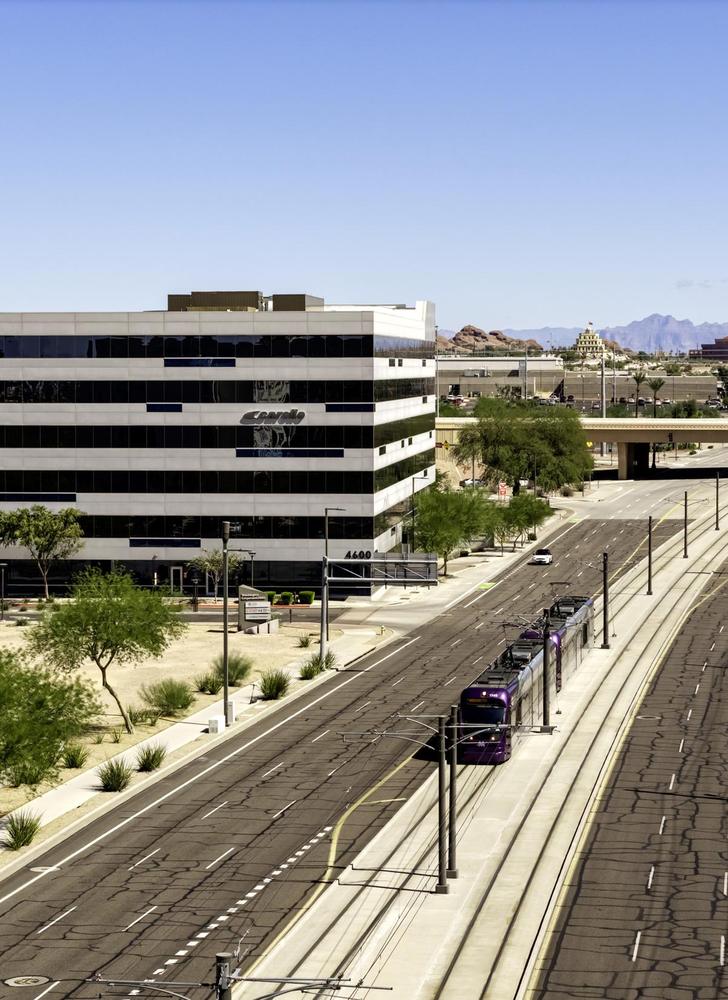
  • Valley Metro light rail runs along the building's Washington Street frontage; the 44th St/Washington station is one block west and connects directly to the PHX Sky Train.
  • Sky Harbor International Airport is five minutes away—by car or rail.
  • Downtown Tempe and Arizona State University are ±10 minutes; Downtown Phoenix ±15 minutes—both reachable by light rail.
Freeway frontage, light rail at the door and the airport five minutes away.
Light rail train passing 4600 E. Washington
Aerial of 4600 E. Washington from above SR-143
SR-143 frontage with Sky Harbor and the downtown skyline beyond.
02

Property Overview

Site summary · building specifications · site plan · parking garage · floor plates · stacking plan · interiors · floor plans
Property Overview

Site Summary

Address4600 East Washington Street
Phoenix, AZ 85034
Site size±2.88 acres (±125,235 SF)
Parcel124-10-044
ZoningC-2 / M-R — Intermediate Commercial, Mid-Rise overlay, City of Phoenix
Year built2008
AccessWashington Street frontage; vehicle access from 45th Street (Washington Corporate Center)
Parking781 spaces · 4.15 / 1,000 SF
606 covered • 159 deck • 13 + 3 accessible
Capital improvementsTwo new cooling towers (Feb. 2023). Roof original; recoat anticipated.
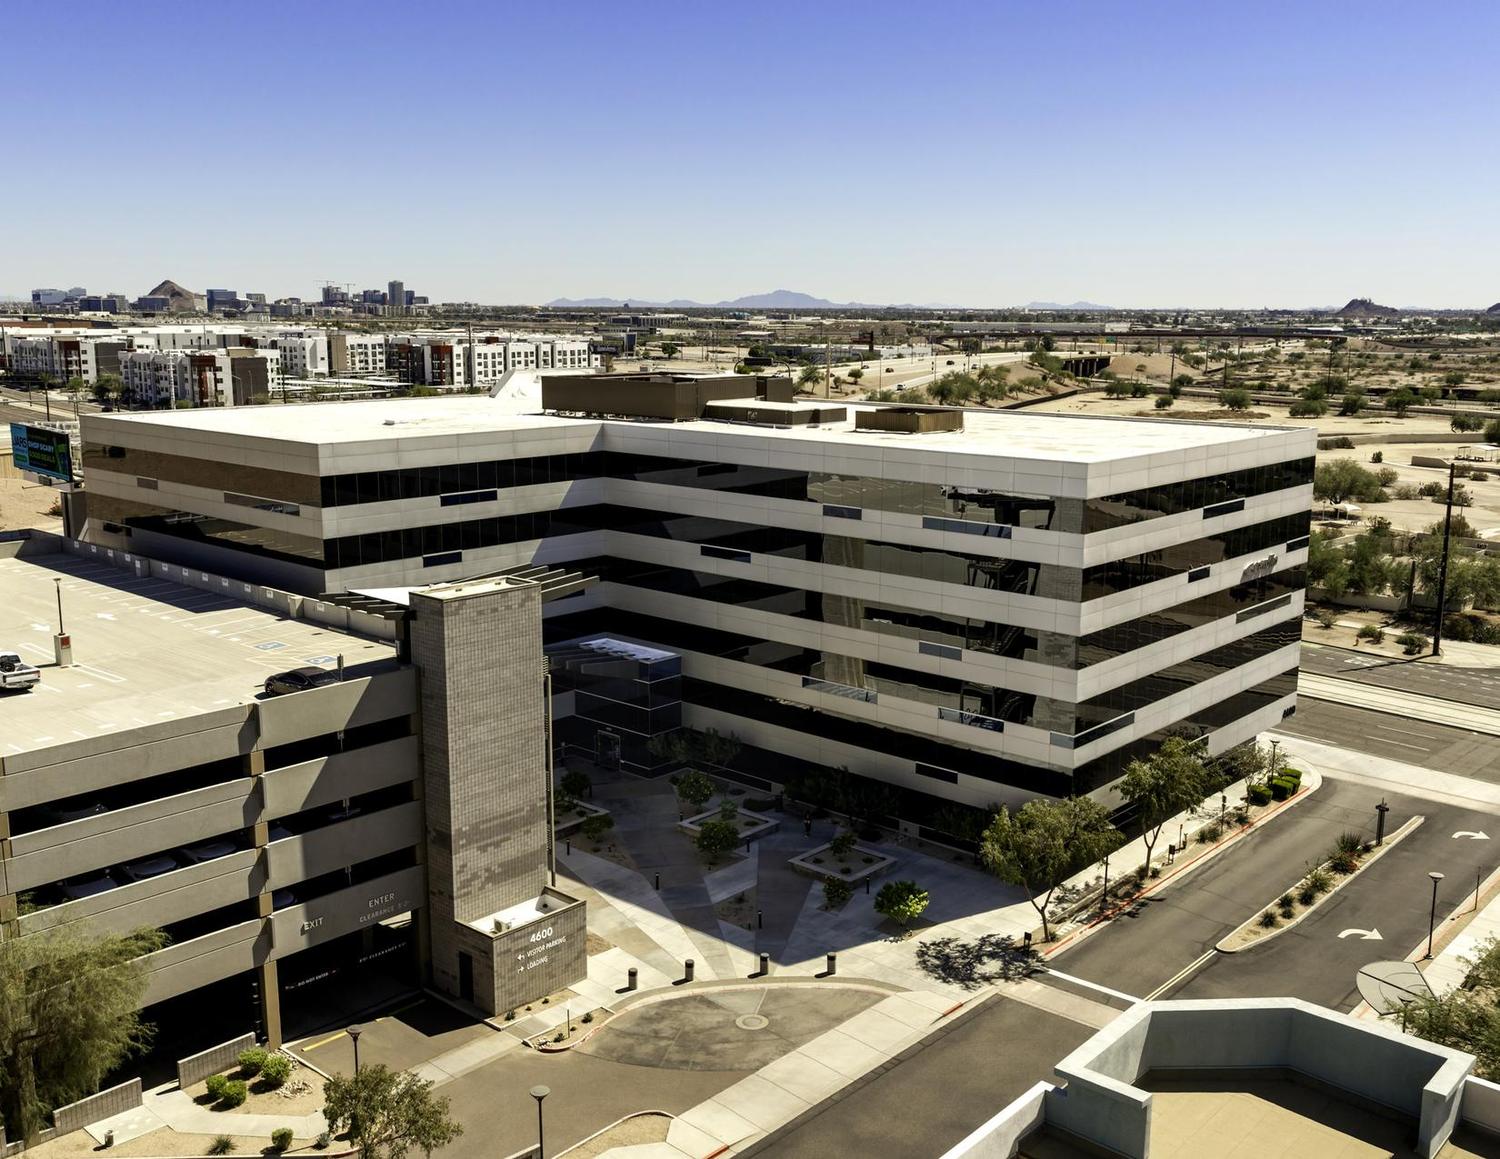
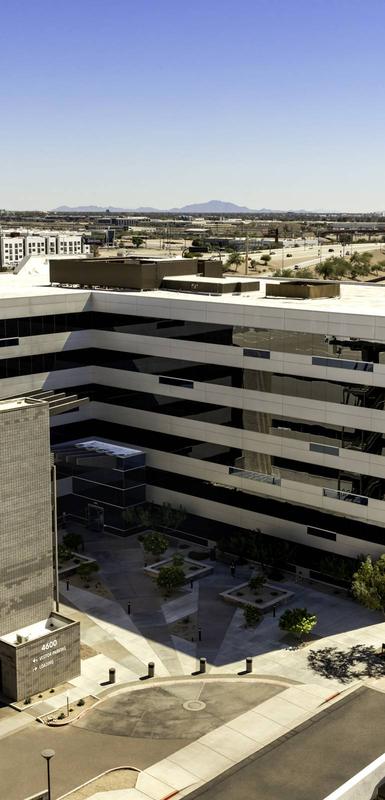
Aerial of the site with SR-143 and the garage
Building exterior detail
Property Overview

Building Specifications

StructureReinforced concrete columns supporting post-tensioned beams and 6″–7″ post-tensioned floor slabs.
ExteriorArchitectural aluminum panels with a ribbon-window glazing system; signature exterior blue light panels.
RoofOriginal (2008) spray-applied urethane foam (minimum 3″, average R-30) with acrylic UV protective top coat; maintained with periodic repairs—a recoat should be anticipated.
ElevatorsThree (3) gearless traction passenger elevators and one (1) gearless traction freight elevator serving all six floors.
HVACCentral plant with two 186-ton cooling towers—both newly installed in February 2023—and air handling unit, remotely monitored; office areas controlled by a Johnson pneumatic system.
Electrical480/277-volt, 3-phase, 4-wire service (APS). Emergency diesel generator in the parking structure for life-safety loads.
Life safety / securityFully fire-sprinklered; card-access and energy-management systems; on-site security.
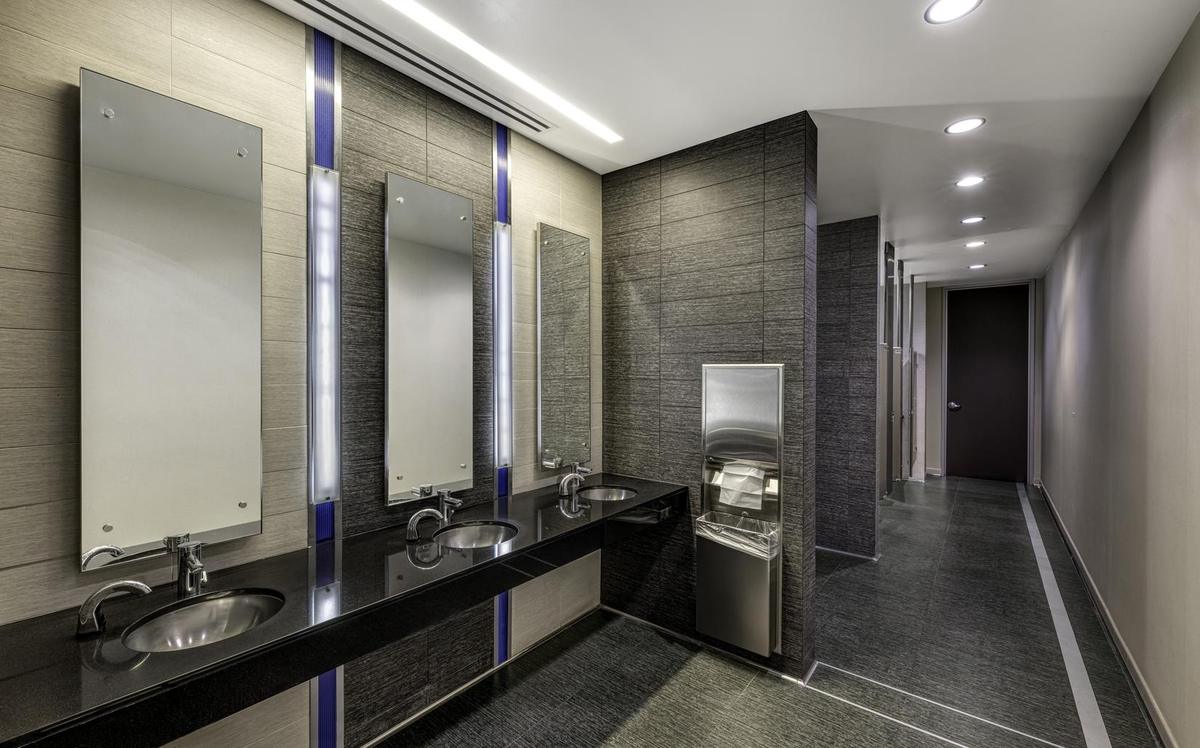
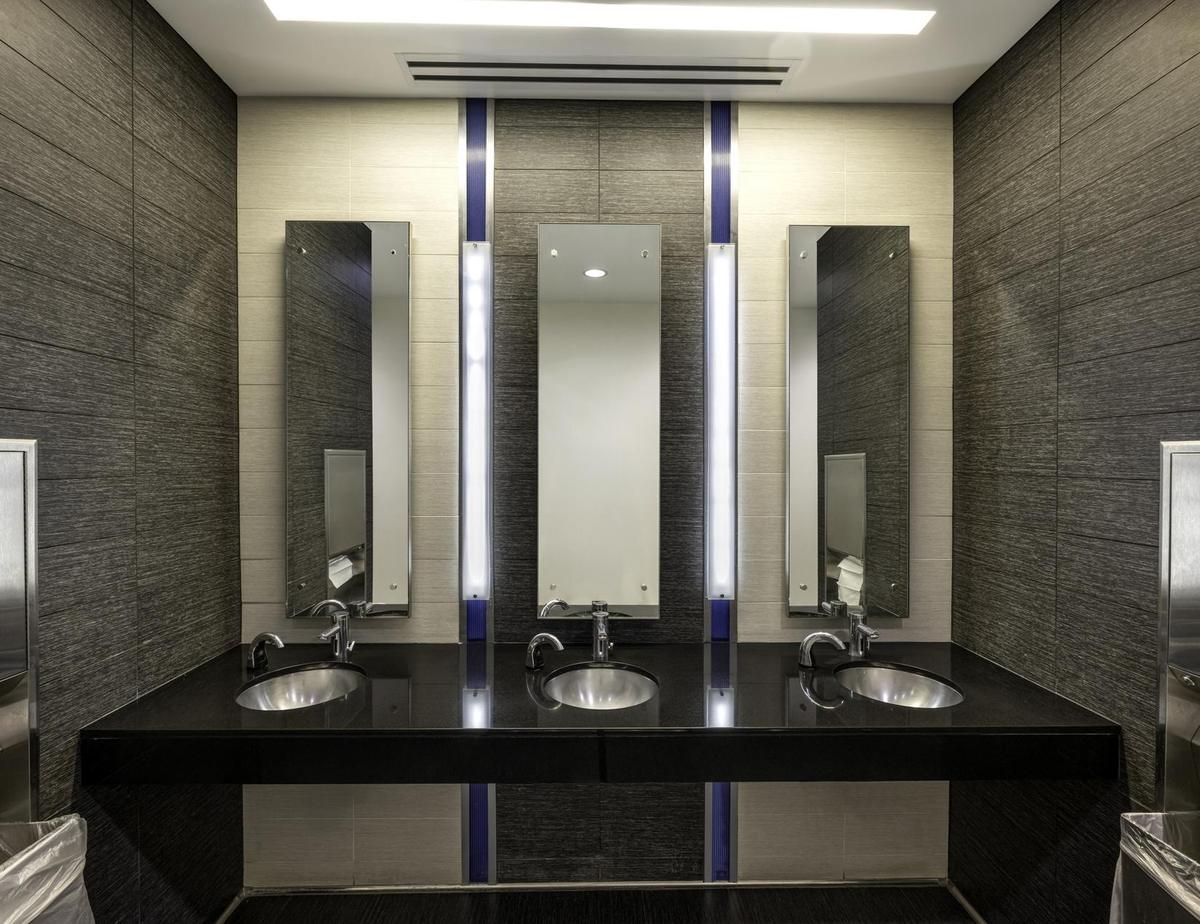
Interior finishesPatterned stone and aluminum lobby flooring; granite, commercial-grade carpet, ceramic tile and polished concrete in suites; porcelain-tile restrooms.
Parking garageDetached five (5)-level structure (2008) of precast concrete; 781 total spaces (606 covered, 159 deck, 13 covered accessible, 3 deck accessible), 4.15/1,000 SF overall.
UtilitiesAPS electric; City of Phoenix water and sewer; Southwest Gas; fiber/telecom via multiple carriers.
Aerial of 4600 E. Washington and garage
Property Overview

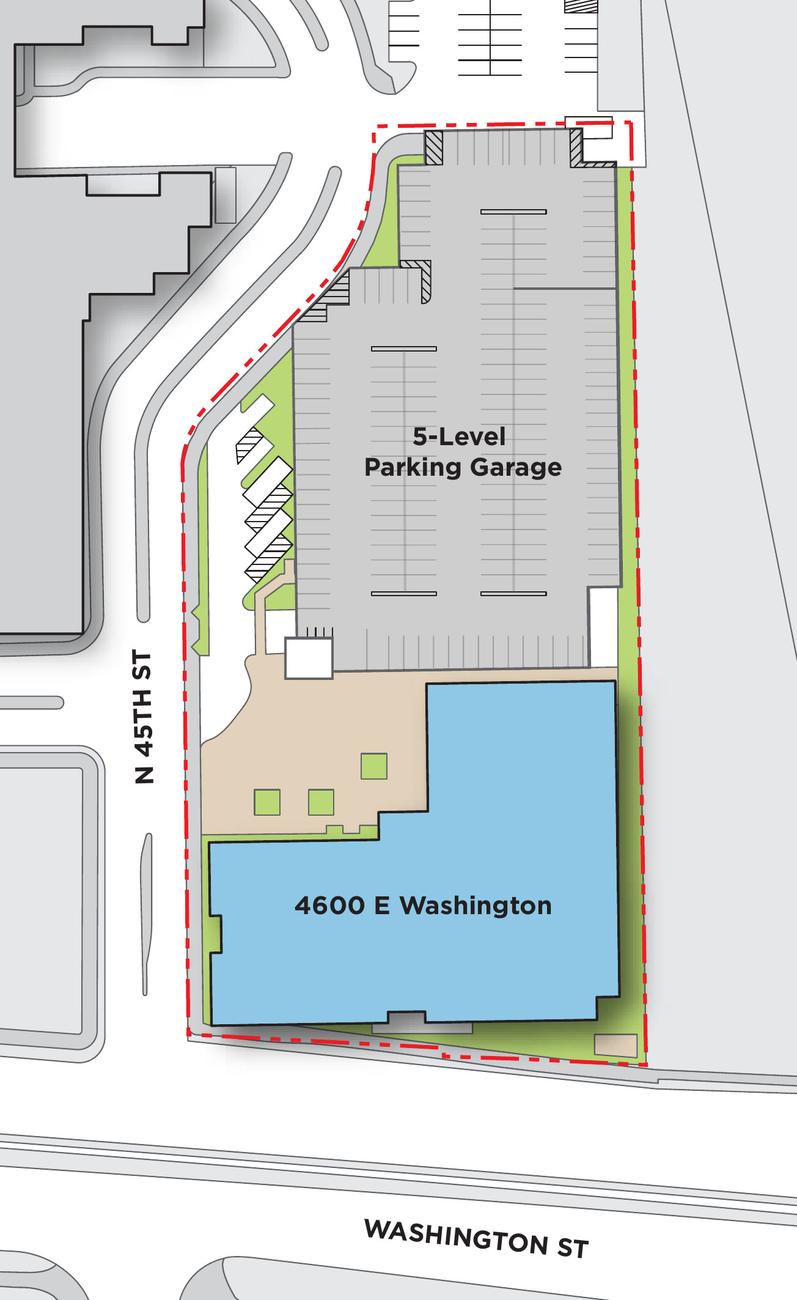
Site Plan

Subject building4600 E Washington—six stories, ±188,311 SF
Parking garageFive levels: 606 covered spaces and 159 top-deck spaces plus 16 accessible stalls—781 structured spaces, 4.15 per 1,000 SF
Property line±2.88-acre (±125,235 SF) site at the northeast corner of N 45th Street and Washington Street
Surface parking7 ground-level spaces plus 159 open spaces on the garage top deck
781 structured spaces at the front door—4.15 per 1,000 SF.
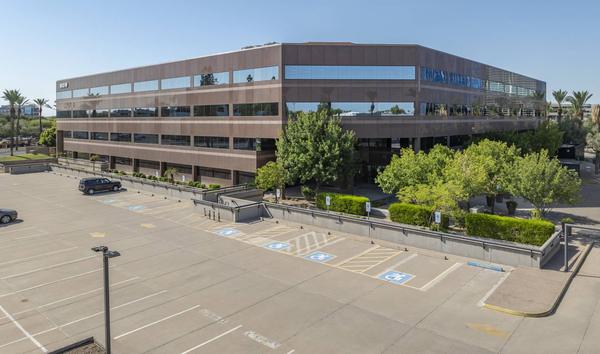
Garage and building from Washington Street
Site plan: building, five-level garage, Washington Street and N 45th Street
Property Overview

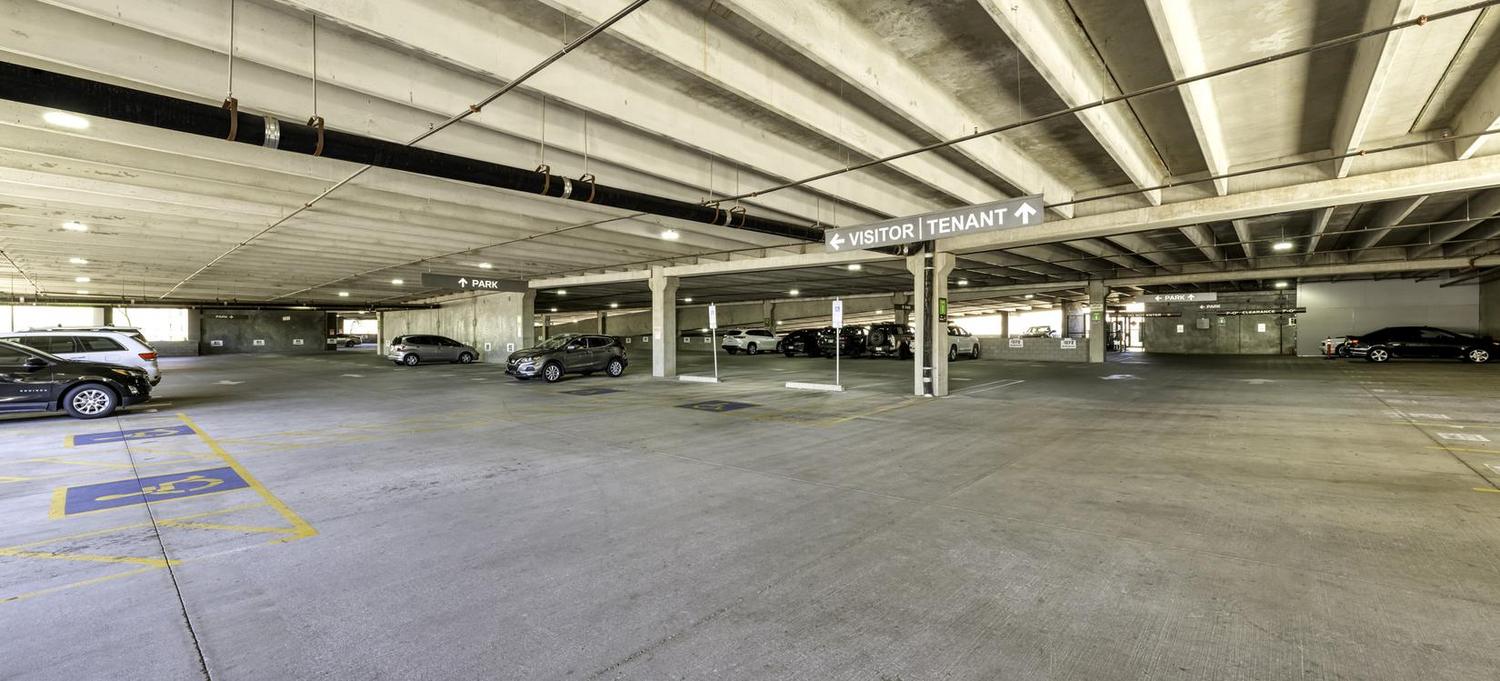
Detached Five-Level Parking Garage

  • Covered, structured parking for the majority of the building's stalls—a competitive advantage through Phoenix summers.
  • 781 total spaces, 4.15 per 1,000 SF: 606 covered and 159 deck spaces in the garage, plus 13 covered and 3 deck accessible spaces; reserved and visitor parking on the ground level.
  • Garage parking offers a future ancillary income source as the building re-tenants.
4.15Per 1,000 SF
781Total spaces
5Garage levels
Five-level parking garage
Property Overview

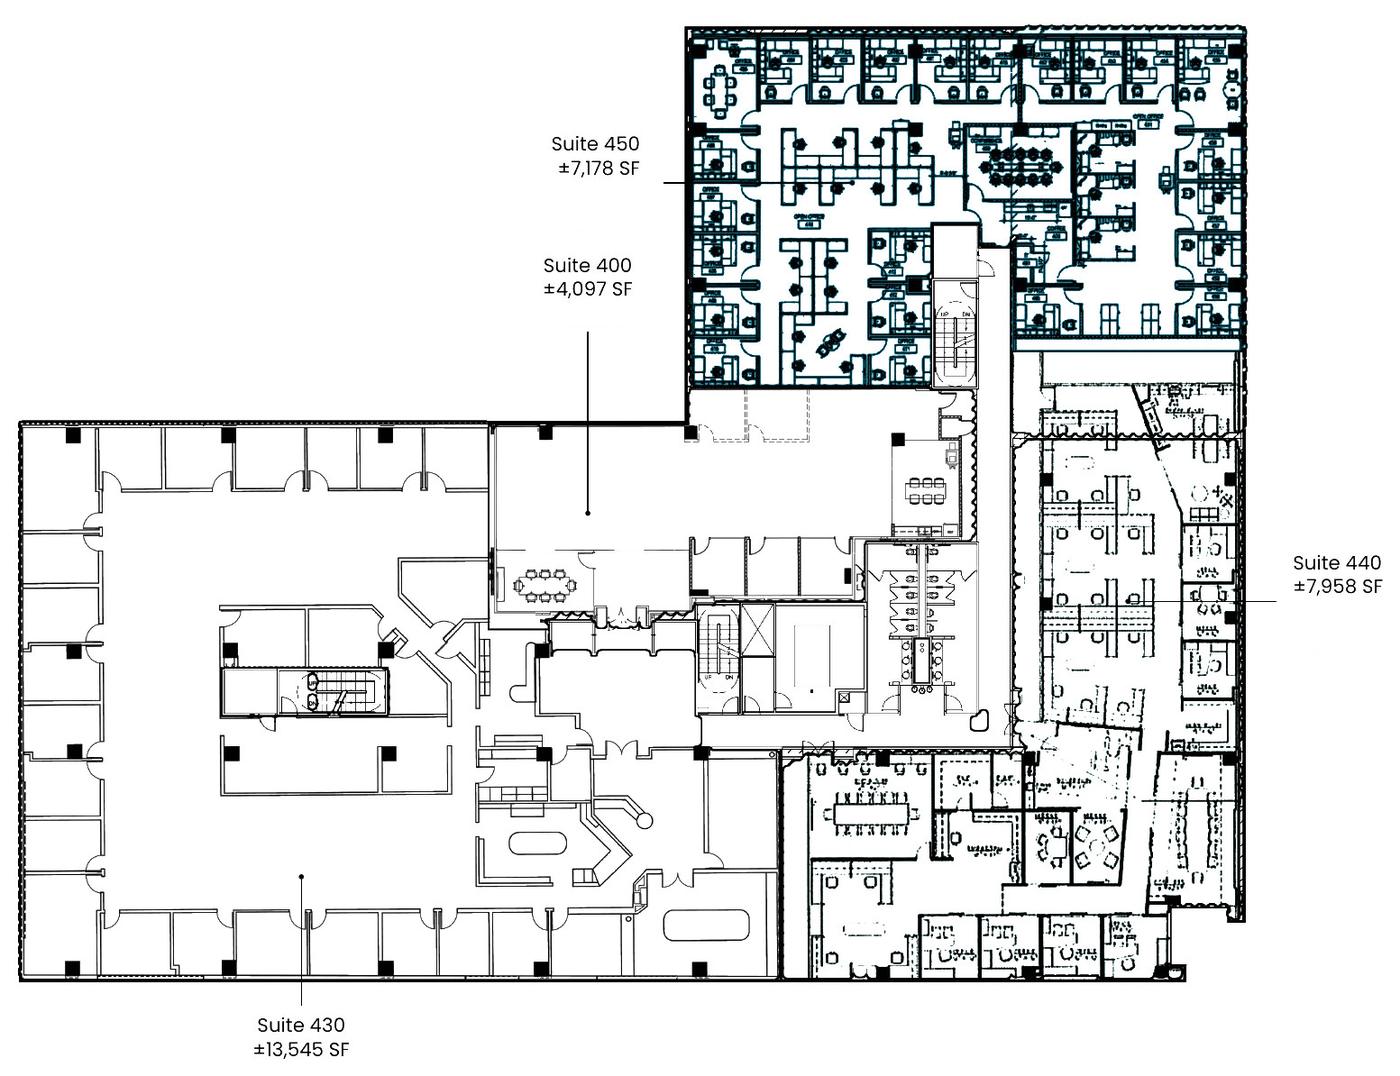
Typical Floor Plate — Fourth Floor

Four suites around a central core—a plate that works for full-floor users and 5,000–15,000 SF tenants alike.
Fourth floor shown. Suite boundaries per the leasing plan; the second and sixth floors are available as full ±31,000–32,000 SF plates (see the Stacking Plan and the floor plans).
Fourth-floor typical plate with four suites around the core
Property Overview

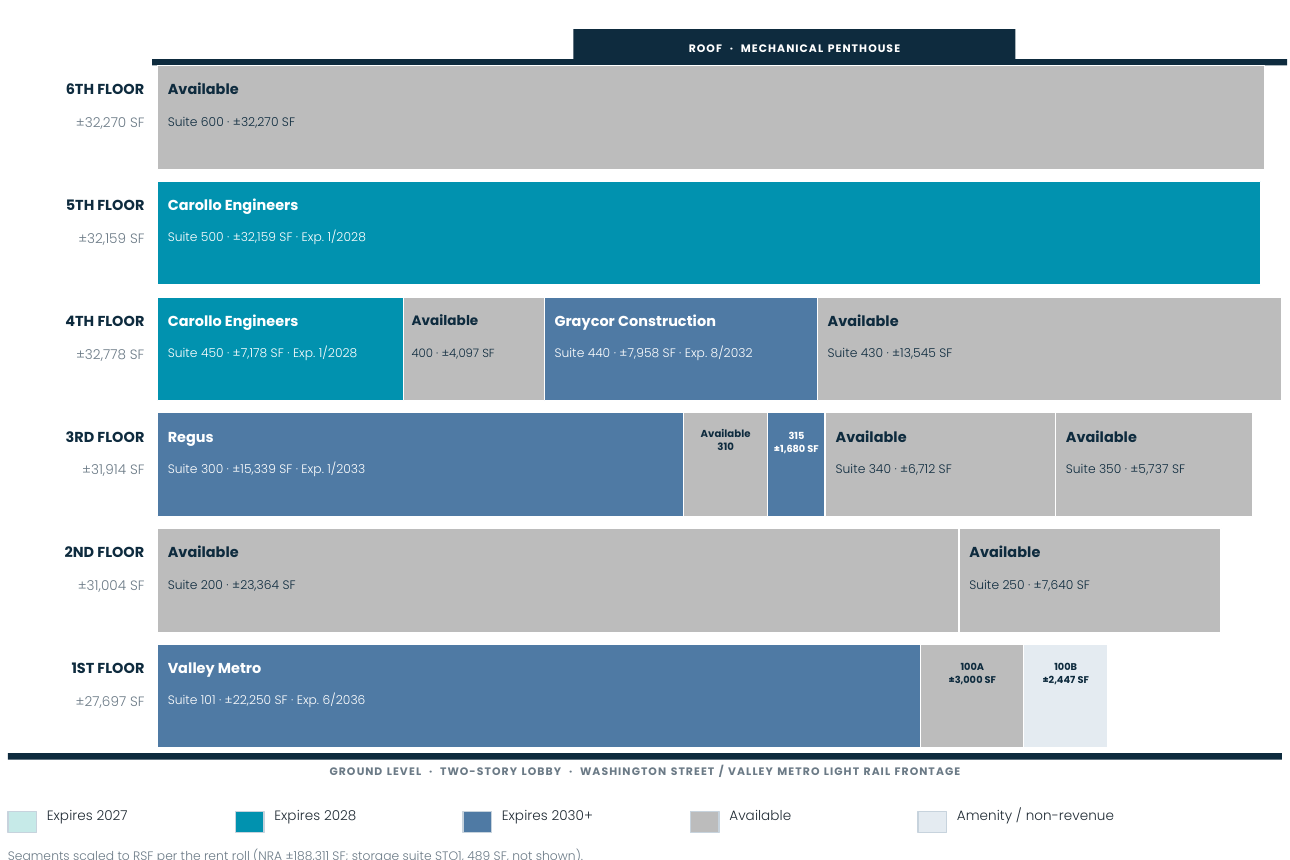
Stacking Plan

Stacking plan: floors 1–6 with tenants, available suites and expirations
Segments scaled to RSF per the rent roll (NRA ±188,311 SF; storage suite STO1, 489 SF, not shown). Expires 2028: Carollo. Expires 2030+: Graycor (8/2032), Regus (1/2033), Valley Metro (6/2036).
Property Overview

Second-Generation Improvements

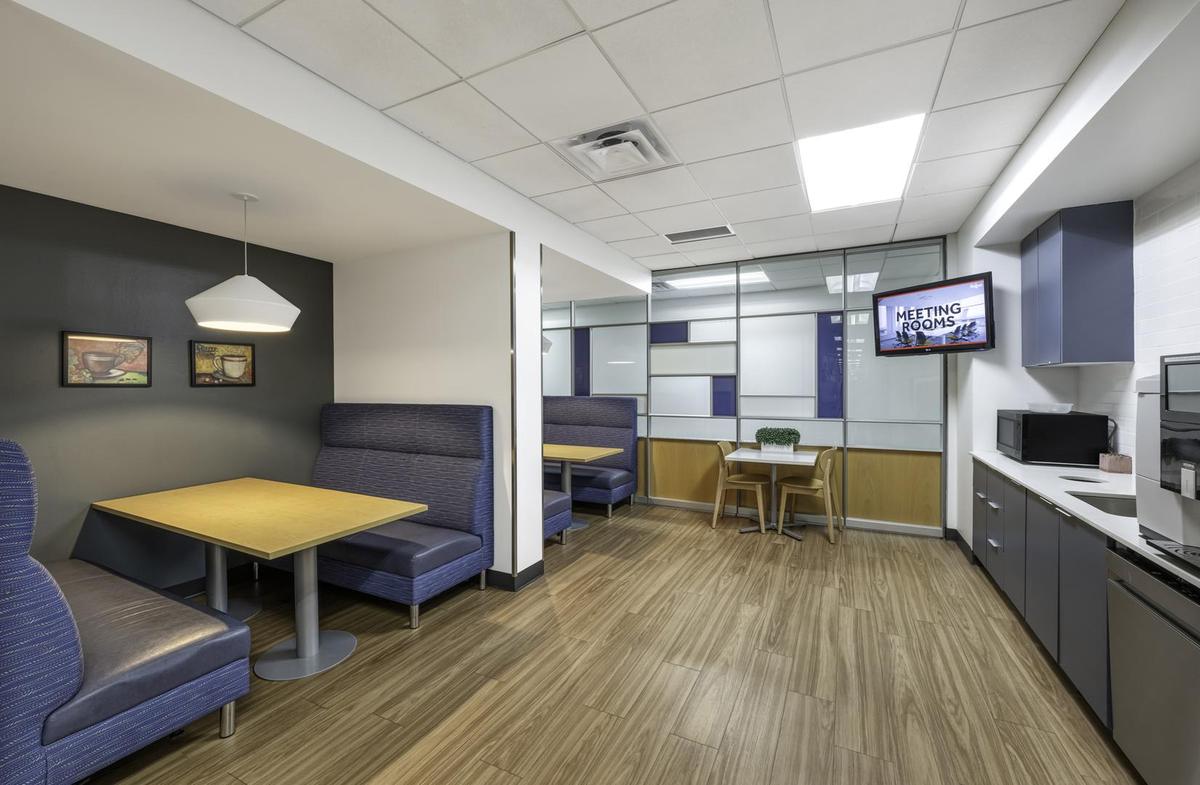
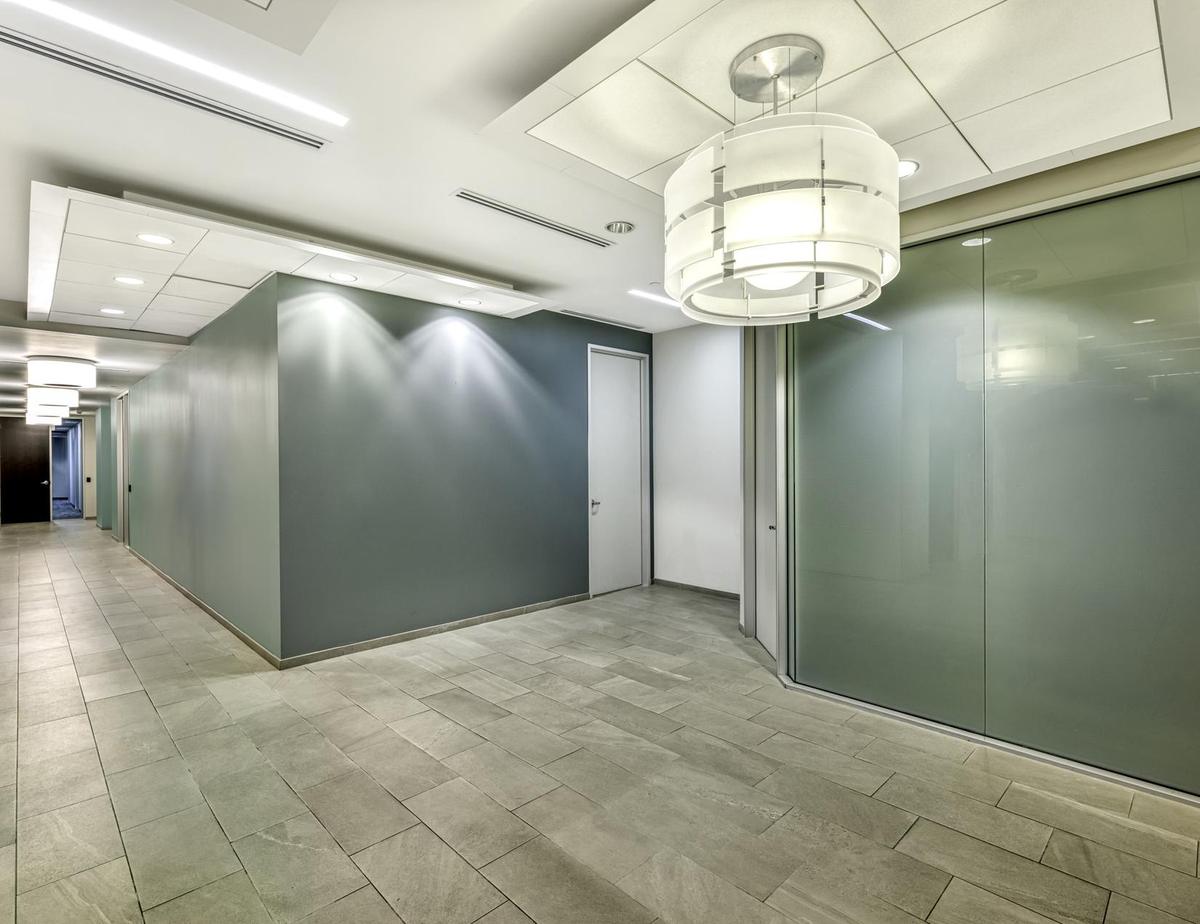
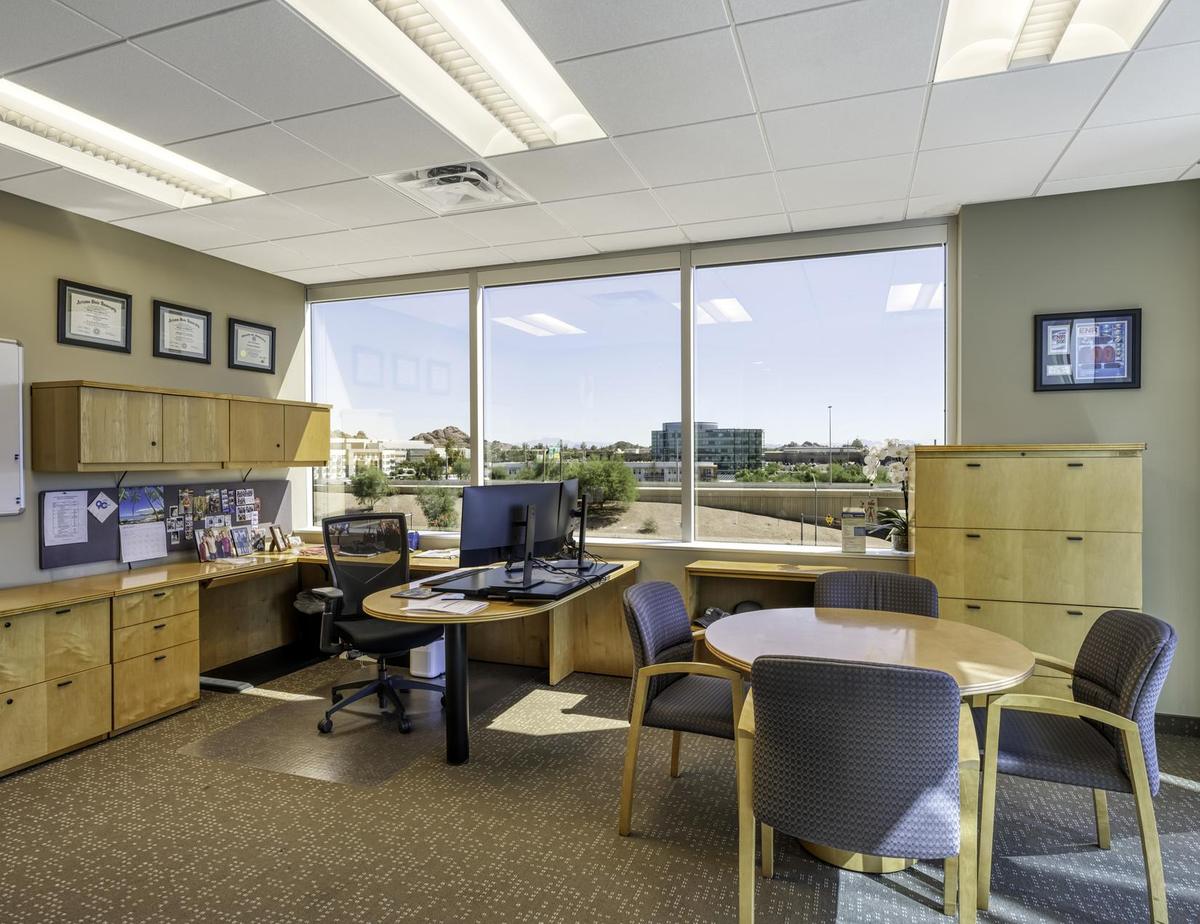
Second-generation improvements—from executive suites to creative open plans—lease with minimal capital.
Property Overview

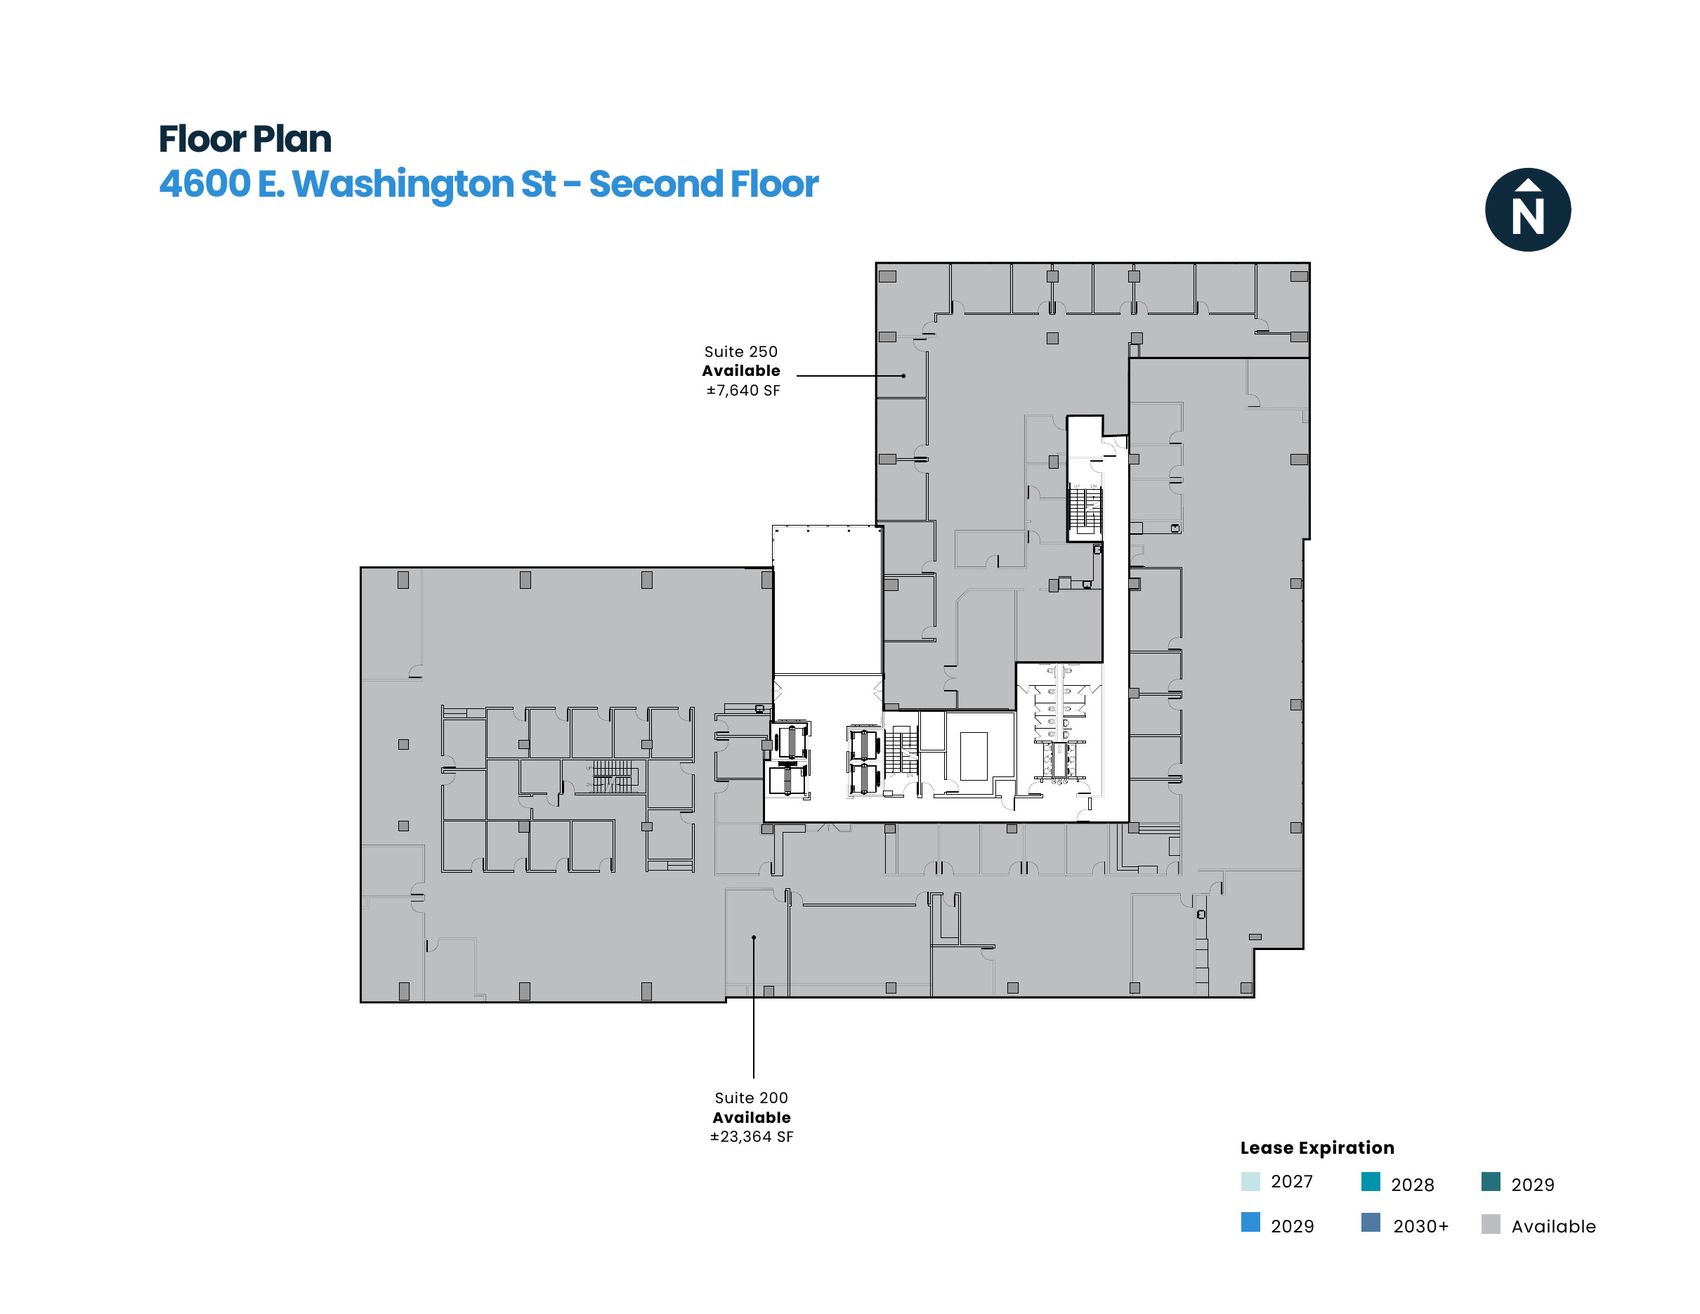
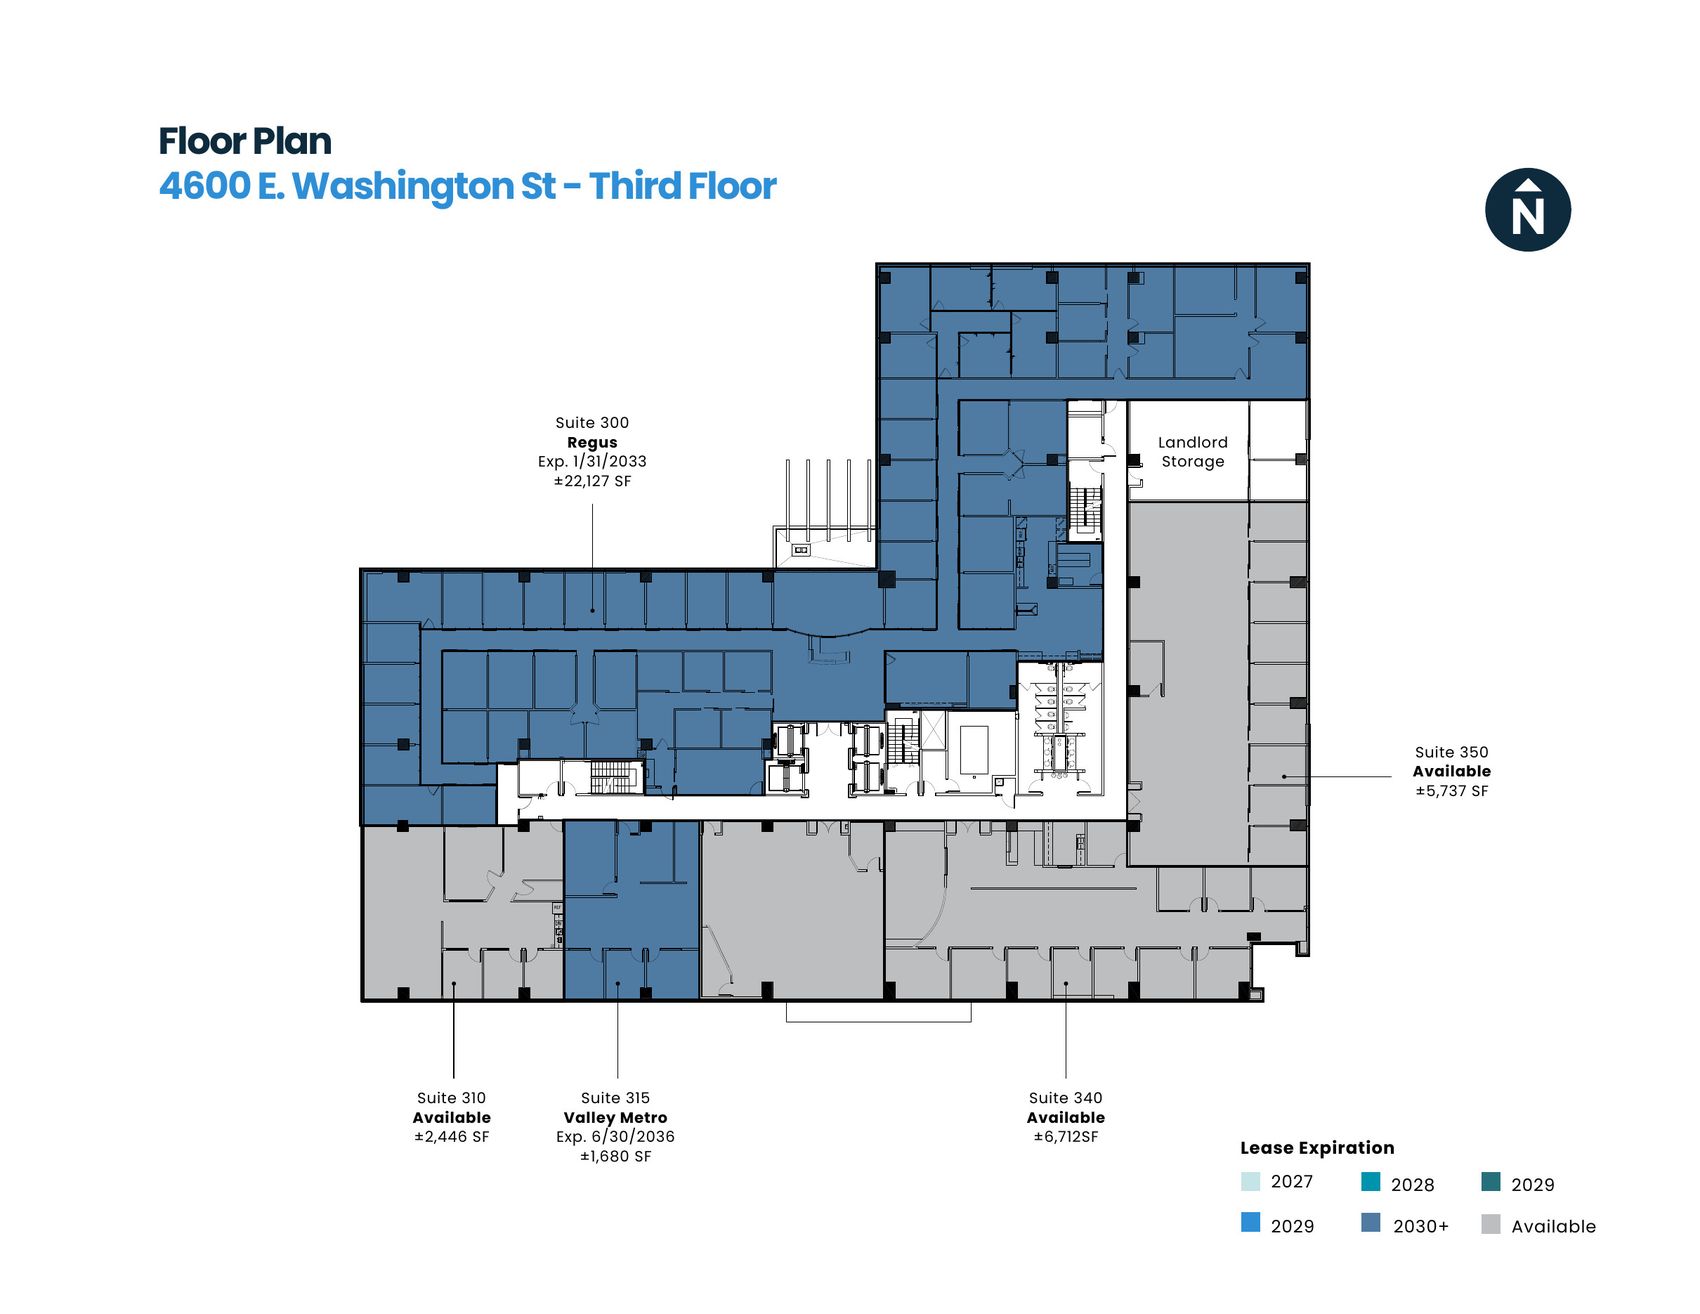
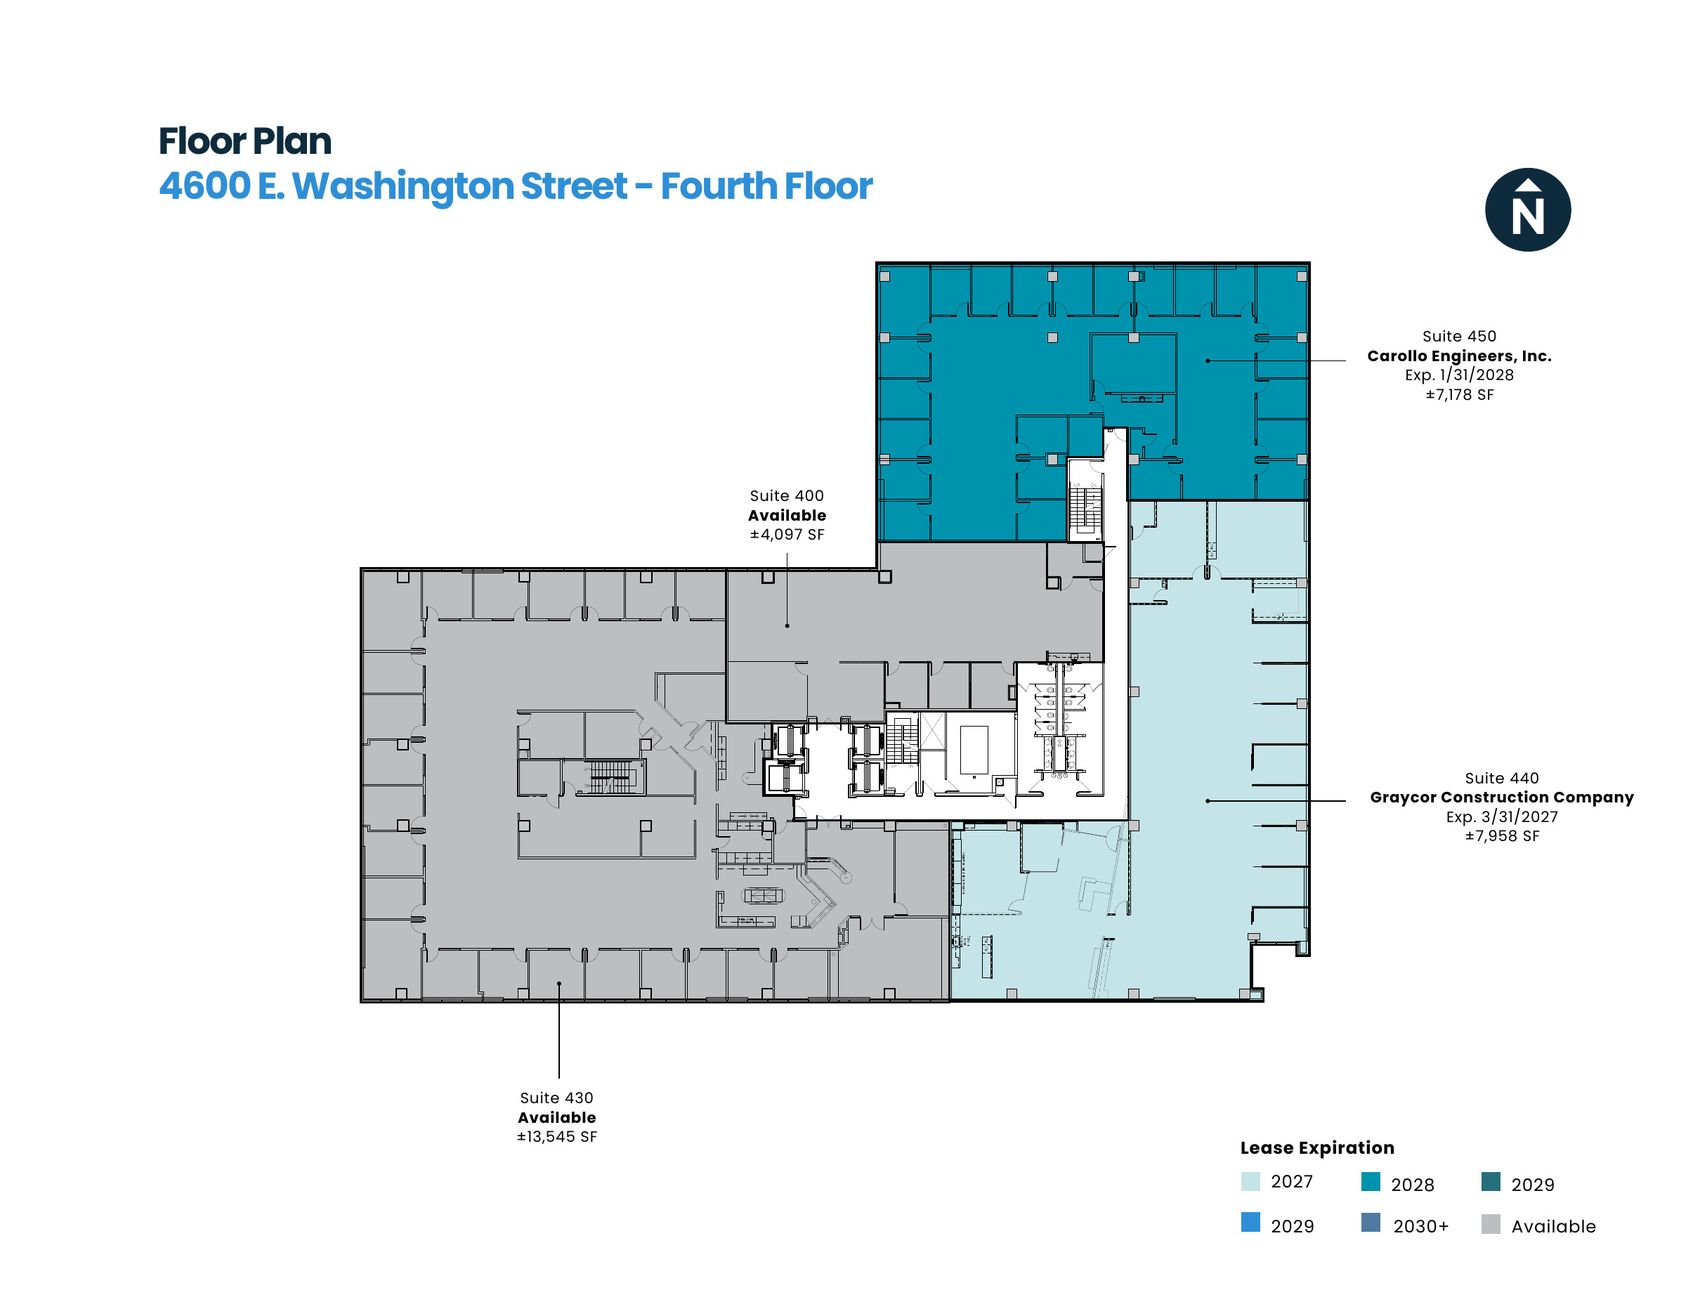
Floor Plans

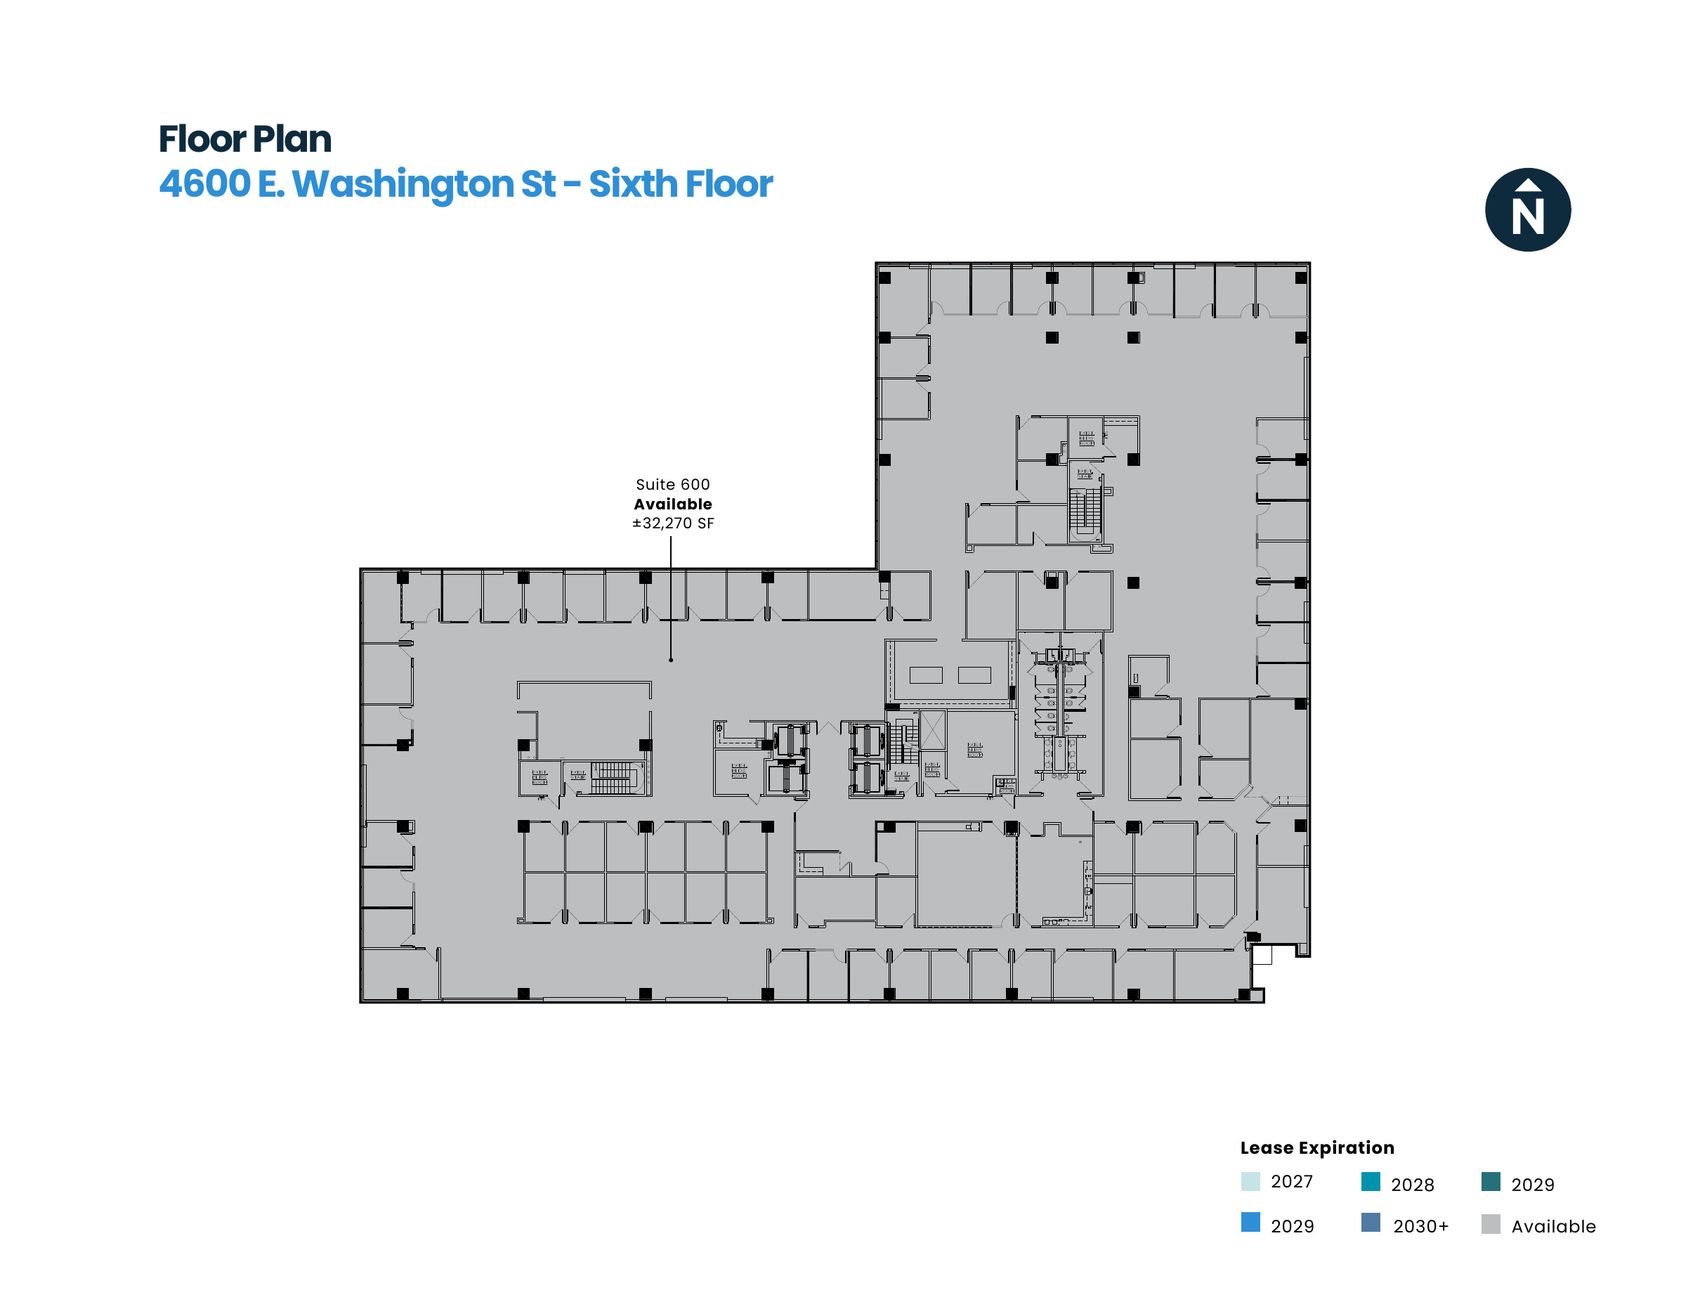
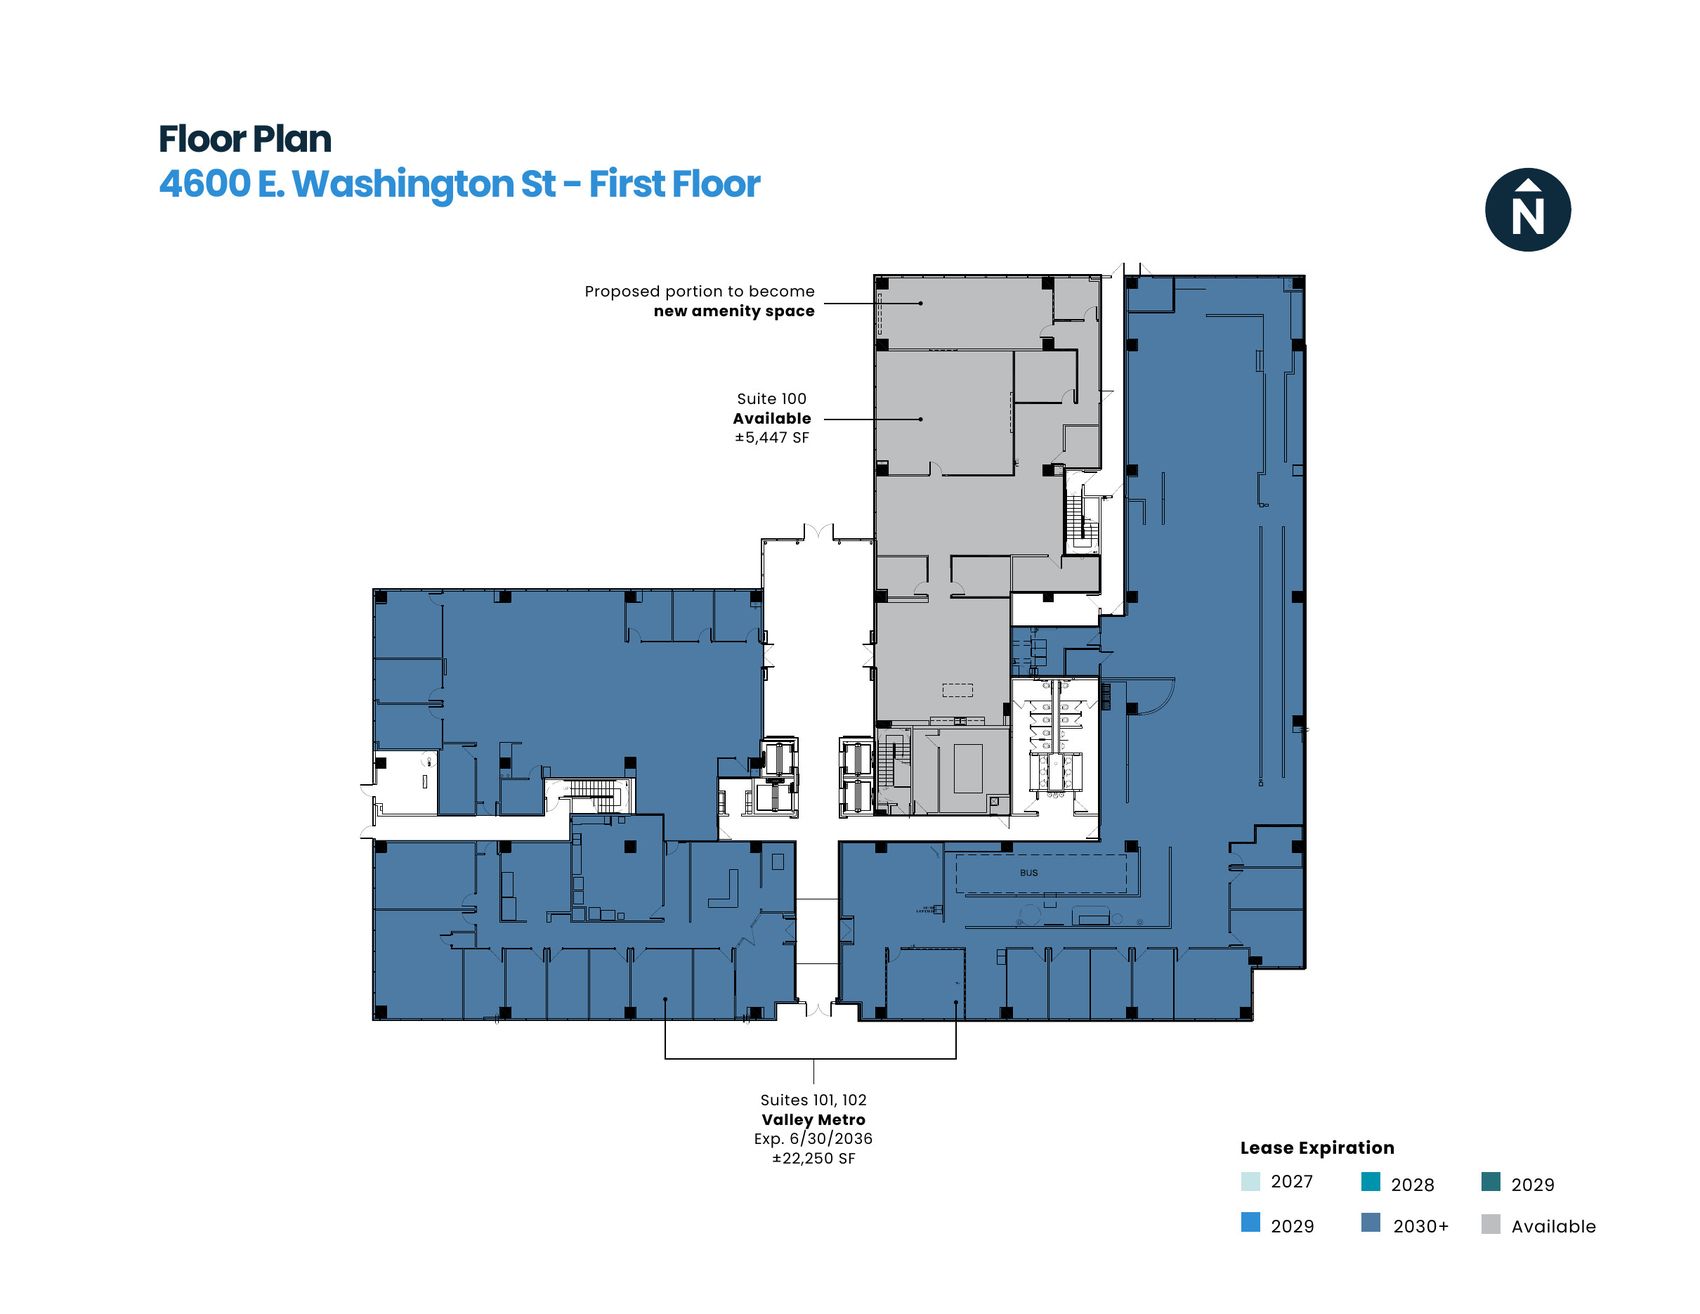
Floor 1 planFloor 2 planFloor 3 planFloor 4 planFloor 5 planFloor 6 plan
03

Market Overview

Metro Phoenix · North Airport/44th Street Corridor · Camelback & Tempe · lease comparables · competitive set · investment sales
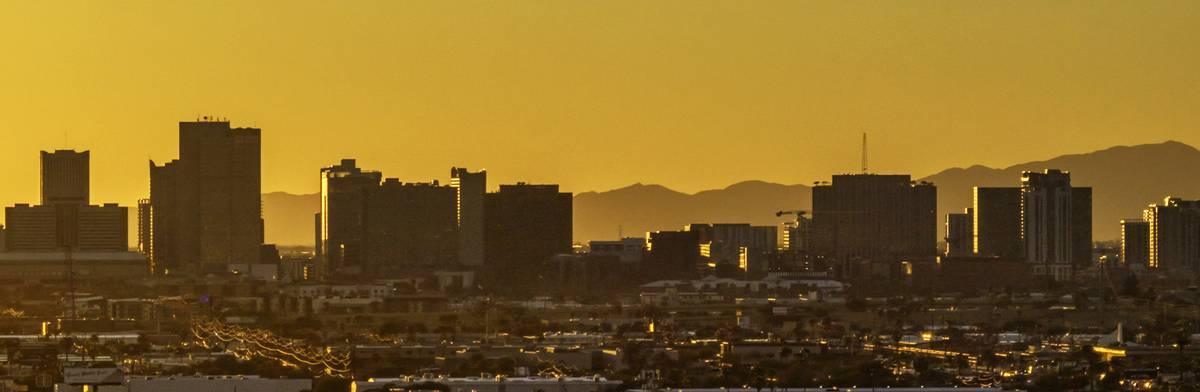
Phoenix skyline
Market Overview

Metro Phoenix Office Market — Q3 2026

85.99 MSFTotal inventory
25.1%Overall vacancy
0 SFUnder construction
$30.68Overall asking rent
895K SFYTD net absorption
4.1 MSFYTD leasing activity

Metro Phoenix posted its third consecutive quarter of positive net absorption in Q3 2026—896,000 SF year-to-date—with no office space under construction anywhere in the metro. The supply side has been switched off. Leasing is concentrating where tenants find quality at a defensible cost: Camelback Corridor and Tempe Class A asking rents have reached $52.76 and $50.81/SF against a $30.68 metro average—the spread that drives the Gateway trade area. The quarter's largest lease landed in the subject's submarket: Western Alliance Bank's 108,960 SF at One and Three Gateway.

Source: Cushman & Wakefield Research, Phoenix Office Market Snapshot and Class Stats Tables, Q3 2026.

Significant Q3 2026 new leases

BuildingTenantSF
One & Three GatewayWestern Alliance Bank108,960
3133 CamelbackMcCarthy Building Cos.96,252
The AlamedaLincoln Tech91,037
Collier CenterAZ Commerce Authority44,734
Marina Heights DTesla (sublease)42,000
Market Overview

North Airport / 44th Street Corridor

The North Airport/44th Street Corridor is a compact, 2.45 million SF submarket at the center of the Valley's freeway and light-rail systems. Its headline vacancy is distorted by two facts: the 108,960 SF Western Alliance lease is still counted as vacant until the bank moves in, and Four Gateway (138,240 SF) is being marketed as a vacant owner/user building rather than competing for tenants. Netting those out, the Class A segment that 4600 competes in is re-tenanting faster than any point in the past five years.

More important is the rent relationship. Class A space in the corridor asks $31.06/SF against $52.76 in the Camelback Corridor and $50.81 in Tempe—a 40% discount for institutional-quality buildings a ten-minute drive from both. That relationship, not the headline vacancy, is what drove Western Alliance's consolidation and the leasing at East Gateway. Immediately east of SR-143, the Papago pocket is signing Class B deals at $33.50–$44.00/SF—another marker of where Gateway rents are headed.

The recovery is further along than the statistics show. Across the 15-building Gateway trade area, ±161,000 SF has been leased but not yet occupied—led by Western Alliance's 108,960 SF—and CoStar still counts every foot of it as vacant. Once those tenants take occupancy, the trade area's physical vacancy falls to ±30% (excluding Four Gateway, which is being sold to an owner/user rather than leased). The building-by-building detail is in the Competitive Set and Absorption pages below.

±161,000 SFLeased, not yet occupied — physical vacancy falls to ±30% on move-in
40%Class A discount to Camelback / Tempe
10 min.Drive to either submarket
Class A at $31 in the corridor. $53 on Camelback. $51 in Tempe.

Submarket statistics, Q3 2026

Submarket / ClassBldgsDirect Vac.Overall Vac.Direct Asking
North Airport/44th St — All3036.8%40.9%$28.39
North Airport/44th St — Class A845.6%54.5%$31.06
Camelback Corridor — All6619.9%22.0%$43.50
Camelback Corridor — Class A1819.3%21.3%$52.76
Tempe — All6616.6%23.4%$39.25
Tempe — Class A2610.4%13.8%$50.81
Metro Phoenix — All92421.9%25.1%$31.02
Source: Cushman & Wakefield Research, Q3 2026 Office Market Class Stats Tables. Asking rents are direct, full service.

Leased but not yet occupied — vacant vs. available, 15 buildings

Line chart: physically vacant vs. vacant-and-available; ±161,000 SF leased, not yet occupied
Source: CoStar Aggregate Historical Vacancy Report, October 2026. Detail in the Absorption page below.
Market Overview

The Camelback and Tempe Squeeze

The lease transactions highlight the powerful transformation that has unfolded in the Camelback Corridor and Downtown Tempe markets. Twenty premier Class A deals since July 2025, every one above $61/SF and averaging $66.07, in the two submarkets that bracket Gateway: the Camelback Corridor to the north and Downtown Tempe to the south. Three years ago the same buildings leased at ±$45/SF; ten years ago, in the mid-$20s. Renewing tenants are facing a doubling or more of their occupancy cost.

Gateway sits between the two—a ten-minute drive from either—with Class A asking rents of $30 to $34. That delta, now $30+ per foot, is what is pulling tenants down 44th Street and across the freeway, and it is the demand driver behind every lease in the comparables.

$66.07Avg. Camelback / Tempe Class A deal
$30–$34Gateway Class A rents
A $30-per-foot premium on both sides of Gateway.

Camelback Corridor & Downtown Tempe transactions (top 10)

Building (Submarket)TenantSFRate
Bond (Camelback)One Capital Management2,127$74.16
Arbor Old Town (S. Scottsdale)Serhant1,602$71.16
Camelback Esplanade V (Camelback)Fisher & Phillips9,896$70.00
Bond (Camelback)Montana Commercial Credit1,804$68.18
Bond (Camelback)WFG National Title3,715$67.00
Camelback Esplanade V (Camelback)Majestic Realty3,048$66.00
Camelback Esplanade II (Camelback)Piper Sandler4,866$66.00
Camelback Esplanade I (Camelback)Ryan Transportation21,067$65.00
Camelback Esplanade V (Camelback)BDO11,762$65.00
Bond (Camelback)EverCommerce2,864$64.27
Class A transactions over $60/SF, full-service gross, Oct. 2025–Sep. 2026. Source: CoStar, October 2, 2026.
Market Overview

What the Comps Say

  • Eleven Gateway deals, ±93,800 SF, averaging $32.20/SF (range $30.50–$34.75)—above 4600's $31.00 asking rate, and most of them in buildings of lesser quality.
  • Twelve Papago deals, ±117,400 SF, averaging $38.78/SF (range $33.50–$44.00). Papago is the Class B pocket one freeway east of the subject; Jacobs Engineering (22,508 SF at $40.61) and Zwicker & Associates (25,759 SF at $33.50) show large users paying $34–$41 for frontage on the same Washington Street 4600 fronts on.
  • The two pockets are converging: Gateway asking rents have moved from $28.11 to $31.25/SF in six quarters, and the Western Alliance, iHeartMedia and Pine Health commitments were made at $33.00–$34.75.
  • Against Camelback Corridor and Downtown Tempe transactions averaging $66.07/SF, a Class A floor at 4600 in the low $30s is the lowest-cost institutional-quality option between the two—and the comps say the market will pay more than the asking rate.
$32.20Avg. Gateway deal (11)
$38.78Avg. Papago deal (12)
$31.004600 asking rate
The average Gateway deal of the past year cleared 4600's $31 asking rate.

Gateway deals, Oct. 2025–Sep. 2026

BuildingTenantSignedSFBase rent FSG
East Gateway ISarku Japan Restaurant Group09/202614,215$32.00
Concord PlacePine Health09/202612,250$34.75
Concord PlacePete Pharma08/20261,883$32.00
East Gateway IITrinity Consultants08/20266,800$30.50
Concord PlaceMestaz Law06/20261,431$33.00
The StockyardsButler Design Group06/202612,804$31.00
East Gateway IThe Precisionists05/20264,906$33.50
East Gateway IIiHeartMedia03/202630,426$33.50
Forum North 44Law firm03/20262,446$31.00
East Gateway IIThe Precisionists01/20264,906$32.00
East Gateway IIEocene Environmental Group11/20251,759$31.00
Gross base rents. Source: Cushman & Wakefield lease comps, October 14, 2026.
Building exterior
Market Overview

Gateway Trade Area — Building-by-Building

Three Gateway
Three Gateway
One Gateway
One Gateway
Two Gateway
Two Gateway
Four Gateway
Four Gateway
501 Gateway
501 Gateway
Gateway Executive Center
Airport Tech Center (2 bldgs)
East Gateway I & II
East Gateway I & II
5555 Office Building
The Stockyards (2 bldgs)
5055 E Washington
5055 E Washington

Trade area totals

RBA SFVacant SFAvailable SFLeased*Direct asking
Trade area total (15 bldgs) — physical1,518,762624,764463,81458.9%$31.25
Total excl. Four Gateway (14 bldgs) — incl. signed leases1,380,522486,524325,57476.4%$31.25
Market Overview

Vacancy Is Already Being Absorbed

Gateway trade area (15 buildings, 1.52 MSF) — vacant vs. available

Line chart: physically vacant vs. vacant-and-available, Q1 2024 to now; ±161,000 SF leased not yet occupied
Source: CoStar Aggregate Historical Vacancy Report, October 2026. *Includes a 1,966 SF 2026 East Gateway expansion per ownership; excludes the 61,000 SF pending lease.
  • The Q3 2026 spike in physical vacancy is Four Gateway (138,240 SF) which has moved to seeking an owner/user (not marketed for lease, only for sale). Strip Four Gateway out and the Gateway trade area's physical vacancy is ±34%.
  • Meanwhile the gap between vacant and available space widened to ±161,000 SF of signed leases waiting to occupy—led by Western Alliance's 108,960 SF. Once in occupancy these tenants lower Gateway's physical vacancy to ±30%.
  • Asking rents in the trade area have risen from $28.11 to $31.25/SF in six quarters—landlords are pricing the recovery and necessary leasing costs, not chasing tenants.
±161,000 SFLeased, not yet occupied
$31.25Trade-area direct asking rent, up from $28.11
±70%Trade area leased, net of signed leases
±161,000 SF leased and waiting to move in. Rents up $3/SF in six quarters.
Gateway trade area aerial
Market Overview

Gateway Investment Sales

  • Four Gateway-area office buildings have traded since August 2024—450,467 SF for $53.25 million, an average of $118/SF—and each sale was brokered by this Cushman & Wakefield team.
  • The two stabilized assets, Gateway Executive Center (100% leased) and 501 Gateway (82%), sold at $176–$227/SF and 7.5%–9.2% cap rates.
  • The two value-add assets, East Gateway I & II (43% leased) and COFCO Gateway Medical (35%), sold at $82–$93/SF—a basis from which both are now being re-leased.
  • 4600 is offered unpriced. A 2008 Class A building at ±48% leased sits squarely in the value-add band these trades define.
4Gateway sales since 8/2024
$53.25MAggregate price
$118/SFAverage price
$82–$227Price / SF range
Value-add at $82–$93/SF. Stabilized at $176–$227/SF.
East Gateway I & II

East Gateway I & II

4646 & 4686 E. Van Buren St.
Price
$19,000,000
Price / SF
$82.30
Cap rate
3.77%
Occupancy
43%
WALT
4.89 yrs
Sale date
Sept. 2025
Size / built
230,864 SF · 2001
Profile
Value-add

$4.7M renovation recently completed; one mile north of Sky Harbor at the convergence of Tempe and the Camelback Corridor.

Sold by this Cushman & Wakefield Toci/Wichterman Team
Gateway Executive Center

Gateway Executive Center

1048 N. 44th Street
Price
$9,050,000
Price / SF
$226.75
Cap rate
7.47%
Occupancy
100%
WALT
3.5 yrs
Sale date
Sept. 2024
Size / built
39,912 SF · 2006
Profile
Stabilized

Renovated with creative-style TIs 2021–2023; rooftop deck; immediate Loop 202 access.

Sold by this Cushman & Wakefield Toci/Wichterman Team
COFCO Gateway Medical Building

COFCO Gateway Medical Building

690 N. Cofco Center Court
Price
$7,200,000
Price / SF
$93.04
Cap rate
4.64%
Occupancy
35%
WALT
—
Sale date
Aug. 2024
Size / built
77,386 SF · 2002
Profile
Value-add · medical

Renovated lobby, restrooms and staircase; vacancy in gray shell; transit-oriented near Loop 202, SR-143 and Sky Harbor.

Sold by this Cushman & Wakefield Toci/Wichterman Team
501 Gateway

501 Gateway

501 N. 44th Street
Price
$18,000,000
Price / SF
$175.94
Cap rate
9.15%
Occupancy
82%
WALT
3.2 yrs
Sale date
Dec. 2024
Size / built
102,305 SF · 1998
Profile
Stabilized

Floor plates accommodate large and small tenants; 12% gray shell; excellent freeway access via Loop 202 and SR-143.

Sold by this Cushman & Wakefield Toci/Wichterman Team
04

Financial Analysis

Net operating income · cash flow projection · operating expenses · assumptions · rent roll · monthly income · tenant profiles
Print the numbers
Financial Analysis

Net Operating Income Analysis

48%Occupancy today · 2017–2021: 94–95%
$394,026In-place NOI (forward 12 months)
$2,901,345Stabilized Year 4 NOI (98.4%)
$27.89Avg. base rent (in place)
Stabilized NOI more than seven times in-place.

NOI summary

In-place (fwd 12 mo.) · 47.5%Pro forma Year 4 · 98.4%Pro forma Year 5 · 98.4%
AnnualPSFAnnualPSFAnnualPSF
Scheduled Rental Income$2,503,409$27.97$6,056,140$67.67$6,185,818$69.12
Available Space$3,092,888$16.42$0$0.00$0$0.00
Potential Gross Income$5,794,752$30.77$6,421,131$34.10$6,637,410$35.25
Effective Gross Income$2,701,865$30.19$5,747,956$64.22$5,973,669$66.74
Total Operating Expenses$2,307,839$12.26$2,846,611$15.12$2,933,343$15.58
NET OPERATING INCOME$394,026$2.09$2,901,345$15.41$3,040,326$16.15
(1) In-place lease income (Year 1) includes all scheduled rent increases and assumes the renewal of leases expiring before the end of the first year. (2) Operating expenses are based on the 2026 budget increased by 3%, with published real estate taxes and a 2.5% (market) property management fee. Property size 188,311 RSF. Source: Cushman & Wakefield underwriting, October 2026.
Financial Analysis

Cash Flow Projection

$388,795Year 1 NOI (CY 2027)
$2,901,345Year 4 NOI — stabilized
30 monthsProjected lease-up period
$10.9MPro forma cost to stabilize
  • Calendar years beginning 1/1/2027; Year 4 (CY 2030) is the stabilized year at 98.4% occupancy.
  • Capital costs of ±$10.9 million in Years 1–3—tenant improvements, leasing commissions, reserves and the $450,000 amenity program—carry the lease-up.
  • Operating cash flow turns positive in Year 3 and runs $2.2–$3.0 million in Years 4–8.

Cash flow summary

Calendar years beginning 1/1/2027PSFYR 1 CY 2027YR 2 CY 2028YR 3 CY 2029YR 4 CY 2030YR 5 CY 2031YR 6 CY 2032YR 7 CY 2033YR 8 CY 2034YR 9 CY 2035YR 10 CY 2036YR 11 CY 2037
Base Rents$30.14$5,676,433$5,837,939$5,933,271$6,056,140$6,185,818$6,329,733$6,627,810$6,813,006$6,927,752$7,082,039$7,197,337
TOTAL INCOME$14.35$2,702,575$2,257,715$4,847,153$5,747,956$5,973,669$6,117,569$6,138,521$6,475,081$6,686,380$6,192,436$6,774,948
TOTAL EXPENSES12.292,313,7802,461,2942,738,1822,846,6112,933,3433,014,3273,084,7793,188,8603,267,6753,351,1333,493,615
NET OPERATING INCOME$2.06$388,795($203,579)$2,108,971$2,901,345$3,040,326$3,103,242$3,053,742$3,286,221$3,418,705$2,841,303$3,281,333
TOTAL CAPITAL COSTS4.66877,1399,127,661900,17241,15542,389231,790846,791586,2931,665,2582,084,380
OPERATING CASH FLOW($2.59)($488,344)($9,331,240)$1,208,799$2,860,190$2,997,937$2,871,452$2,206,951$2,699,928$1,753,447$756,923
Financial Analysis

Operating Expense Summary

$13.88Pro forma operating expenses / RSF
$13.352026 budget / RSF
$12.492025 actual / RSF
Pro forma expenses are the 2026 budget plus 3%, with a market 2.5% management fee.
Expense notes. (1) Pro forma expenses are based on the 2026 budget increased by 3%, with the exceptions and clarifications noted. (2) Based upon a square footage of 188,311 RSF. (3) Pro forma amounts for variable costs are estimates. (4) Pro forma Janitorial Contract/Supplies is an estimate and is assumed to include day-porter services at ±$0.35/SF. (5) The initial year's management fee is based upon a fee of 2.50% (amount shown is the first year's grossed-up management fee). (6) Property taxes are based on the 2027 property-tax estimate; all subsequent years inflate at the property-tax inflation rate on the Table of Assumptions.

Reimbursable expenses — totals

Reimbursable Expenses2024 ACTUALPSF2025 ACTUALPSF2026 BUDGETPSFPRO FORMA (1)PSF (2)
Electric — 60% fixed (3)445,4842.37419,6652.23$465,173$2.47$550,000$2.92
Janitorial Contract / Supplies — 30% fixed (4)241,7091.28216,3251.15269,2621.43300,0001.59
Security285,4201.52298,6591.59312,0001.66321,3601.71
Property Management Fee (5)51,8250.2852,8610.2854,6740.29133,7010.71
Property Taxes (6)761,9424.05732,7113.89750,7333.99620,0653.29
TOTAL RECOVERABLE OPERATING EXPENSES$2,393,578$12.71$2,352,095$12.49$2,513,964$13.35$2,614,462$13.88
Financial Analysis

Table of Assumptions

30 mo.Lease-up period
$31.19Blended market rent
-10.33%In-place vs. market ($3.22)
$13.88Initial-year expenses / SF
FSG Blended Market Rental Rate$31.19
In-Place Year 1 FSG Rental Rate$27.97
Above (Below) Market By-10.33% ($3.22)
Market rent — spec / <10K / 10–20K / >20K RSF$32.00 / $31.75 / $31.50 / $31.00 FSG
Annual rent adjustment3.00%
Retention ratio70%
General vacancy10.00%
Holding period · analysis start10 years · 1/1/2027
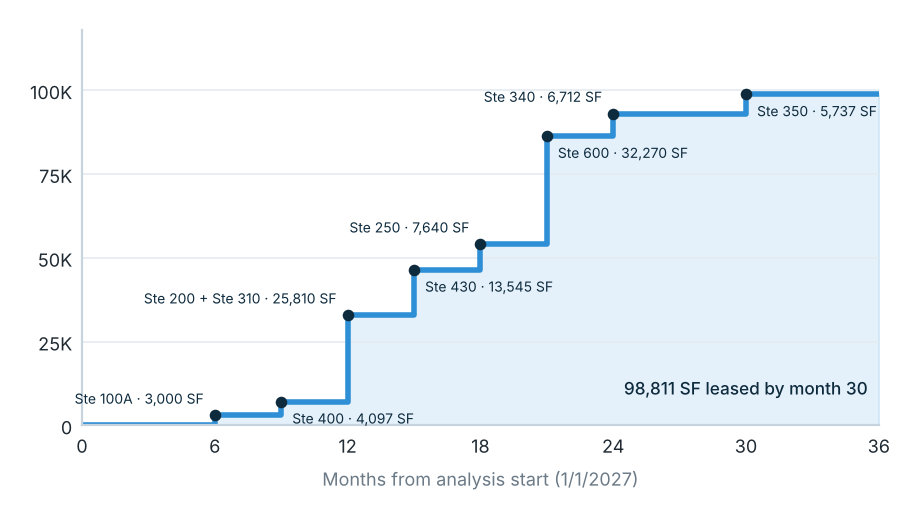
Nine suites, ±98,800 SF, absorbed over 30 months at $31.00–$32.00 FSG.

Projected absorption of vacant space

Chart: projected absorption of nine vacant suites over 30 months

Vacant space lease-up detail

SuiteMonthRentTIATermSq. Ft.
100A6$32.00$100.0065 months3,000
20012$31.00$60.0091 months23,364
25018$31.75$70.0065 months7,640
31012$31.75$25.0065 months2,446
34024$31.75$40.0065 months6,712
35030$31.75$75.0065 months5,737
4009$31.75$25.0065 months4,097
43015$31.50$75.0091 months13,545
60021$31.00$80.00130 months32,270
Total vacant98,811
Financial Analysis

Rent Roll

7.47 yrsAverage lease term (in place)
4.56 yrsWALT (existing tenants)
$27.89Avg. in-place base rent / RSF
98,811 SFAvailable (52% of NRA)
$31.30Avg. market rate, available suites
Two anchors through 2033 and 2036.

In-place tenancy (summary)

SuiteTenantRSFExpiresAnnual rentRate
101Valley Metro RPTA22,2506/30/36$611,875$27.50
300RGN-Phoenix II, LLC (Regus)15,3391/31/33$391,145$25.50
315Valley Metro RPTA1,6806/30/36$46,200$27.50
440Graycor Construction Company7,9588/31/32$230,782$29.00
450Carollo Engineers, Inc.7,1781/31/28$218,929$30.50
500Carollo Engineers, Inc.32,1591/31/28$996,929$31.00
TOTALS OCCUPIED89,500$2,495,860$27.89
TOTAL AVAILABLE (at market)98,811$3,092,888$31.30
PROJECT TOTAL188,311$5,588,747$29.68
Financial Analysis

Scheduled Monthly Income & Lease Expirations

Existing lease expiration schedule

YearLeasesSF Expiring% of NRACumulative
2027000.0%0.0%
2028239,33720.9%20.9%
2029–2031000.0%20.9%
203217,9584.2%25.1%
2033115,3398.1%33.3%
2034–2035000.0%33.3%
2036123,93012.7%46.0%
Non-revenue / storage22,9361.6%47.5%
Vacant—98,81152.5%100.0%
Nothing rolls in 2027. Nothing expires 2029 through 2031.

CY 2027 scheduled income (summary)

SuiteTenantRSFJan 2027Dec 2027CY 2027
101Valley Metro RPTA22,25050,99050,990611,875
300Regus (RGN-Phoenix II)15,33932,59533,235393,062
315Valley Metro RPTA1,6803,8503,85046,200
440Graycor Construction7,95819,23219,895233,435
450Carollo Engineers7,17818,24418,543219,228
500Carollo Engineers32,15983,07784,417999,609
100AAvailable3,0008,0008,00096,000
100BProposed Amenity Suite2,447000
200Available23,36460,35760,357724,284
250Available7,64020,21420,214242,570
310Available2,4466,4726,47277,661
340Available6,71217,75917,759213,106
350Available5,73715,17915,179182,150
400Available4,09710,84010,840130,080
430Available13,54535,55635,556426,668
600Available32,27083,36483,3641,000,370
STO1Storage — not leased489000
Gross Occupied Rents89,500207,988210,9302,503,409
Gross Potential Rents188,311465,729468,6705,596,296
Scheduled rents for calendar year 2027. Expiring leases are assumed to be renewed at market. Scheduled Rental Income and potential Available Space income shown in the In-Place NOI are pulled from this table.
Financial Analysis

Tenant Profiles

Carollo Engineers, Inc.Suites 500 / 450 • ±39,337 SF • Exp. 1/2028

Founded in 1933 and headquartered in Walnut Creek, California, Carollo is one of the largest environmental engineering firms in the United States focused exclusively on water and wastewater. Employee-owned, with offices across the country, Carollo has occupied the entire fifth floor of 4600 since 2011.

Valley Metro Regional Public Transportation AuthoritySuites 101 / 315 • ±23,930 SF • Exp. 6/2036

Valley Metro is the regional public transportation agency for metro Phoenix, operating the Valley's bus system and light rail. A tenant since 2011, Valley Metro executed a new ten-year lease at 4600 in 2026, with rent commencing January 2027.

Regus (RGN-Phoenix II, LLC)Suite 300 • ±15,339 SF • Exp. 1/2033

Regus is the flagship brand of IWG plc, the world's largest provider of flexible workspace, with thousands of locations worldwide. The Regus center at 4600 has served small and mid-sized businesses in the Gateway trade area since 2012.

Graycor Construction CompanySuite 440 • ±7,958 SF • Exp. 8/2032 (pending renewal)

Graycor is a privately held general contractor founded in 1921 and headquartered in the Chicago area, with a Southwest regional office at 4600 serving commercial, industrial and institutional clients across Arizona.

Four tenants. Average tenure of more than a decade. Two anchors through 2033 and 2036.